Building a Lean Supply Chain: Lean shouldn’t stop with your company; to be truly lean, you must reach beyond your shop floor.
Companies of all sizes, shapes, and descriptions are attempting to implement lean manufacturing. As a company becomes lean, however, it inevitably runs into constraints imposed by its suppliers and customers, the adjacent nodes of the supply chain in which it operates. The logical next step to becoming lean internally is to try to spread the lean philosophy outward to those immediate trading partners. Sometimes doing so can bring significant improvements, especially when a large company is influencing one or more of its smaller suppliers. At other times it doesn’t work so well, such as when a small machine shop attempts to influence a much larger raw-material supplier.
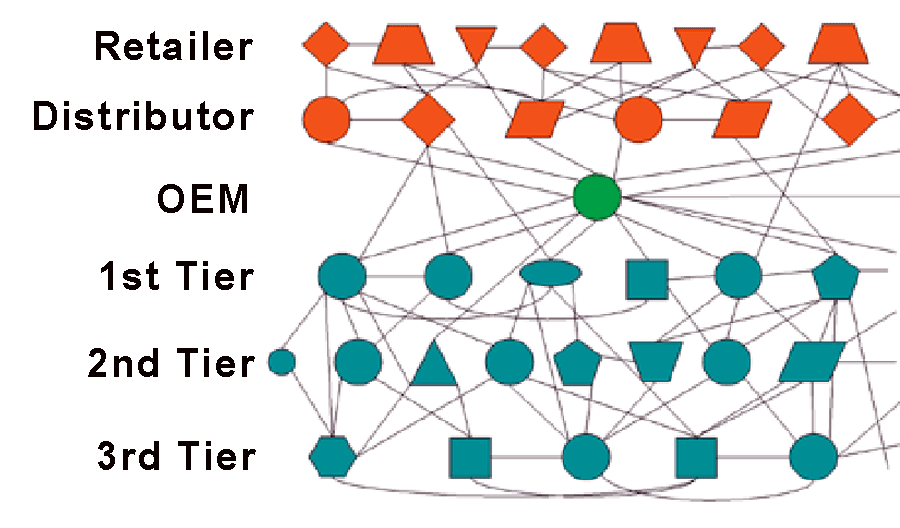
 In concept, a supply chain looks something like the drawing above. Of course this diagram is simple compared to a real supply chain, because the total number of organizations involved at all levels for a complex product such as a car or airplane is in the thousands or even tens of thousands.
Unfortunately, “lean” has become a marketing term, and is attached to many tools and methods which are, at best, peripheral to true lean manufacturing. At its core, becoming lean means reducing waste to the greatest possible extent, where “waste” means any activity or cost that does not directly add value to the product from the customer’s point of view. Think of lean as an incremental optimization process. The gradual elimination of more and more waste leads to greater and greater efficiency. And if lean is implemented properly, it can increase flexibility.
Even in the rare case in which all the organizations that make up a supply chain are busily implementing lean internally, from the supply-chain view this amounts to a collection of local optimization activities. Anyone familiar with system optimization will tell you that a collection of localized optima within a system rarely leads to an overall optimum. Therefore, to develop a lean supply chain, you need to apply lean to the supply chain as a system.
A supply chain is defined as the collection of all the organizations that contribute directly to the manufacture and delivery of a product. The most complete view of a supply chain centers on the original equipment manufacturer (OEM). It extends up through distribution and delivery to the end customer, and down through tiers of suppliers of raw materials.
So what does it take to build a lean supply chain? A complicated network is too much to tackle at once. This is a classic “eating the elephant” situation. You need to select and address a piece of it at a time. Fortunately, the Pareto Rule generally applies, with 20% of the supply chain responsible for at least 80% of the issues. You can, therefore, begin the process by working with a key subset of the overall supply chain.
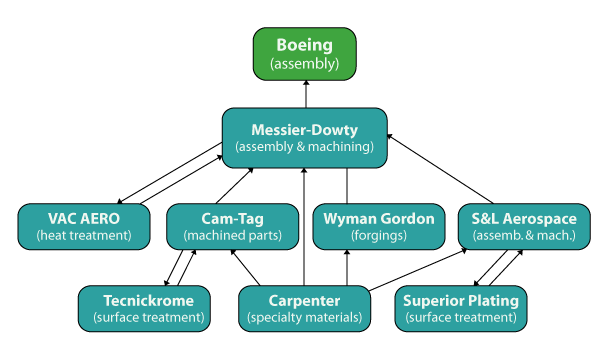
Consider the supply chain that provides Boeing’s F/A-18 E/F Super Hornet® assembly line with its nose landing gear. This chain was the focus of a recent lean supply chain effort funded in part by the US Navy’s Office of Naval Research. The overall goals of the effort were to reduce the lead-time and cost related to producing the nose gear with no loss in end quality.
Landing gear are basically hydraulic systems primarily composed of machined parts. Boeing Integrated Defense Systems and its first-tier supplier, Messier-Dowty, Inc. were well along in implementing lean within their facilities–with demonstrated success. Both recognized the need to reach out to their supply chains. They jointly decided to develop a lean supply chain with the Navy’s financial support, and supply-chain assistance from The Altarum Institute. Boeing chose to work with Messier-Dowty because of the importance of the landing gear to the F/A-18 E/F aircraft’s overall lead time and cost. Messier-Dowty and Boeing then selected the sub-tier suppliers on the same basis–their impact on the overall production of the nose landing gear.
Once you select a supply chain, the next step is to assess the current state of the chain. We recommend using value-stream mapping as the core approach. The idea is to start by capturing a detailed picture of the current state at each of the selected companies (including the OEM) by following a small number of parts through the entire set of business and manufacturing processes. You will want to develop current-state value-stream maps for all processes that directly affect lead time. Thus, the current-state maps should include both business processes and manufacturing processes. For example, it takes a certain amount of time to complete the purchasing process at each company. Overall lead time will drop, along with cost, if that process can be shortened by improving the efficiency of the purchasing operation. The overall supply-chain focus is supported by the assessment team, which constantly looks for opportunities related to interactions and impacts from trading partners. Inevitably, the value-stream mapping process will identify opportunities for improvement, within each company and between companies.

Of course, mapping the individual companies is not enough to understand the supply chain as a system. The first component of that understanding comes directly from the assessment process. We recommend that a core team of people from the major supply-chain members conduct all the individual company assessments. That core team will gain a substantial understanding of the supply chain through the individual assessments. Next, the team can assemble the overall current-state supply-chain value-stream map. Taken as a whole, even a limited supply chain is quite complex. Characterizing the supply chain, therefore, requires a set of views that describe it in a comprehensive, yet understandable, form.
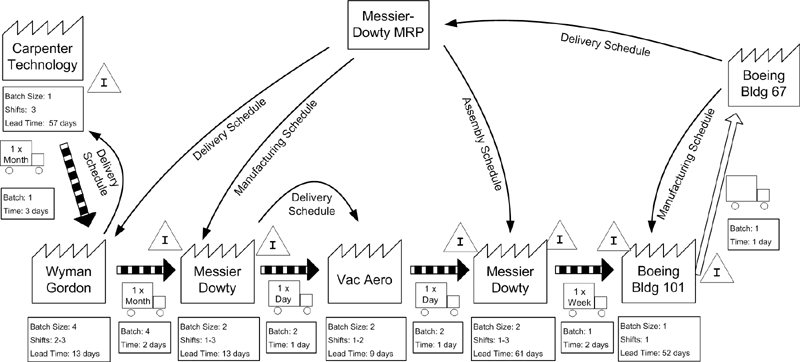
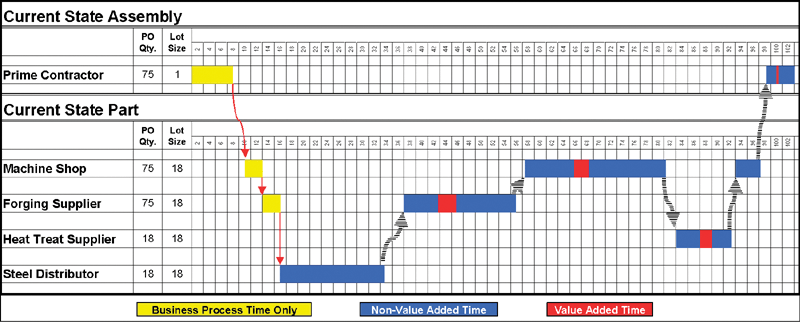
One of the views we recommend is based on the traditional value-stream mapping approach. This is a very high-level view of how a part moves between the companies. The high-level view is deliberately limited. Its purpose is to focus attention on the big picture. A more detailed view is also needed without trying to show every step in every process in every company. For that view, we use a “timeline chart” that shows the business and manufacturing processes sequentially on a single time scale with an emphasis on handoffs between organizations. Capture several different parts on the same timeline chart and you can see which has the longest overall lead time and, therefore, is on the critical path for the overall assembly.
Since value-stream mapping is a graphical approach, there is much more you can do with it. For example, you can use icons and numbers to display information such as special transportation or changing batch sizes. The timeline chart provides an illuminating look at the system as a whole, while keeping the level of detail under control.
Once the current-state maps for both the individual companies and overall supply chain are complete, the process continues to parallel the traditional value-stream mapping approach. Members of the supply chain build future-state maps, which show how they believe the system should look at some defined point in the future. The same kinds of maps can be used to characterize the future state, both at the overall supply-chain level and, in a coordinated fashion, at the individual company level. Developing the future state must be a group process involving all the companies who took part in the current-state assessment. That is, the goals must be shared and jointly agreed to, or there is little chance of success. With the future state determined, the companies can then decide what internal and joint projects they can undertake to move from the current state toward the future state.
Does the approach work? As anyone familiar with lean implementations is aware, it takes considerable time and effort to turn a company onto a new course. A supply chain has even greater inertia. In the nose landing gear supply chain, however, the process of moving toward a leaner future state is underway. The supply chain has seen a 20% reduction in work-in-process inventory. Process improvement activities are expected to lead to a 45% reduction in lead time across the chain. The overall lead time for the nose gear has been reduced from 62 to 48 weeks.
You might look at the numbers and wonder why they do not meet the kinds of numbers you have seen attributed to local lean efforts. That is because those numbers are nearly always localized. Achieving a 50% reduction of 2% of an overall process yields only a 1% improvement overall.

Value Stream Mapping
Here’s an example of the high-level view provided by value-stream mapping for a part from the F/A-18 E/F nose gear supply chain. The summary process data captured in the text boxes helps determine where to focus improvement efforts. The flow of schedule information from Boeing through Messier-Dowty is also captured. This view may not capture every company that touches the part. We only documented those companies for which we had detailed information. Other suppliers that provided services for the part were captured implicitly, leaving them as process steps in the relevant company. For example, buried in the Vac Aero box is another supplier that provides testing services to Vac Aero.

Preparing a Timeline
Unfortunately, the F/A-18 E/F timeline chart is too big to show here (it requires an 11 by 17 sheet to be legible). In this simple chart we highlight the portions of the overall process that are purely business processes–such as the initial purchasing processes (the yellow bars). We use red arrows to indicate the movement of paper, and capture the time material spends at a given site between handoffs (the blue bars with red portions). Each red bar within a blue bar signifies the value-added portion of the time represented by the blue bar. Some blue bars may not include any value-added time, such as the distributor shown in the example. This does not mean that one can automatically eliminate the entire blue bar. At least some portion of it may be necessary, even though not adding value. Transportation time is captured by gaps between the colored bars. One advantage of the timeline chart is in showing parallel processes. Even this chart is broken into an assembly and one of its parts. All you need to do is add another set of rows below the first part to capture a second part being made in parallel.
By Tom Phelps, Supply Chain Engineer, The Altarum Institute; Mike Smith, Manager Supply Chain Development, Messier-Dowty, Inc.; Teri Hoenes, Supplier Quality and Development Manager, Boeing Integrated Defense Systems.
This article previously appeared in “Manufacturing Engineering” magazine, published by the Society of Manufacturing Engineers.
