Commercial introduction of the Scanning Electron Microscope (SEM) in 1965, and its subsequent rapid development and implementation in metallographic laboratories, has had a profound influence on failure studies. The chief advantage of the SEM is its great depth of field in comparison of the light microscope. Observations can be made over a much wider range of magnifications including those above the range for light microscopes (and those below the range of TEM replicas). Examination of fracture features by SEM is much simpler than through the study of replicas with the Transmission Electron Microscope, TEM. A further advantage of the SEM is the chemical analytical capability of spectrometers that can be attached to the microscope, Energy-dispersive Spectrometers (EDS) being the most common.
The study of fractures with the unaided eye has been practiced since antiquity chiefly for controlling the quality of metals production. R. A. F. de Réammur may have been the first to examine and publish drawings of fractures examined at high magnifications, at least 100X, in 1722. R. Mallet appears to have been the first to link fracture appearance to service performances in a study of failed cannon barrels published in 1856. Adolf Martens may have been the first to study both fracture surfaces and the underlying microstructures in 1878 followed by the first description of fracture surface features in 1887 when he showed that these lineal features could be traced backward to identify the fracture origin.
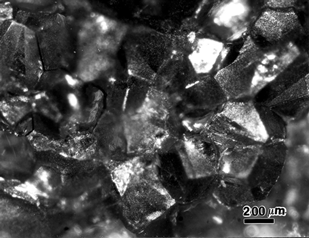
The modern age of the study of fractures began with the 1943 publication of work by Carl Zapffe and George Moore. Zapffe and his associates published a number of studies of fracture appearances, mostly of cleavage fractures in a variety of metals examined with the light microscope. Zapffe and Worden were the first to observe fatigue striations with the light microscope in 1950 (published in 1951). Although Zapffe’s work was interesting and helped stimulate work in fractography (a word he coined along with fractology), few people have subsequently published fractographs taken with the light microscope. As a learning experience, I heartily recommend students to take a relatively flat fracture (of moderate size) and examine it with the light microscope being careful not to run the objective into the fracture which may damage the lens. This is easy to do with 5X and 10X objectives which have a reasonable depth of field and working distance. Examination with higher power objectives is possible but requires more care as the working distances are much less. Try examining the fractures with darkfield illumination after brightfield. Darkfield is good for collecting scattered light and often produces superior results.
Photographing fractures with a light microscope is difficult as only part of the field will be in focus. In the past, one would take a number of images with different regions in focus and glue them together to form a montage mostly in focus. Today, this can be done electronically with the in-focus portion of a number of images of the same area used to create a montage. This is a useful complementary tool to SEM fractography because the SEM cannot detect naturally occurring colors which may be important in some cases.
The inability of the SEM to detect natural colors is one of its chief limitations in failure analysis. Those who rely only upon SEM examination of fractures may experience occasional problems as a result. This writer was involved in such a case where a railroad axle, made from a carbon steel near the eutectoid composition, failed due to liquid metal embrittlement when a bronze friction bearing began to melt due to lack of lubrication. The investigator examining poorly prepared metallographic specimens with the SEM could not detect the copper that penetrated into the grain boundaries. Using the light microscope, the natural color of the grain-boundary copper films could be immediately observed (using properly prepared specimens). Copper and iron are adjacent elements on the periodic table, so atomic number contrast was not present. These films could be observed with the SEM only after they were observed with the light microscope, and a diamond scribe mark was made to identify their location.
| Thermally Embrittled Co-Free Maraging Steel | |
 |
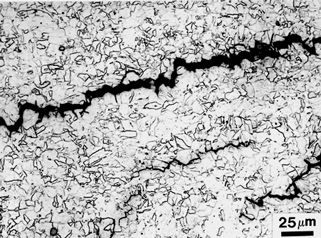 |
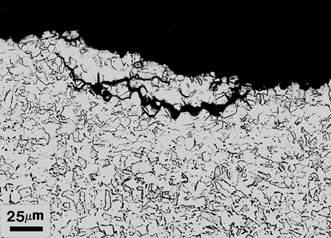
| Figure 3: Two views of the fracture edge and secondary cracks (left) and internal cracks (right) in the Co-free maraging steel mobile assault bridges (mod. Fry’s etch). |
|
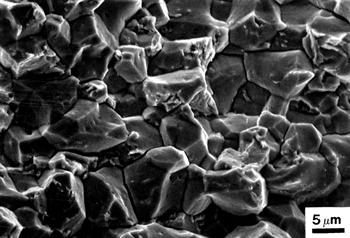
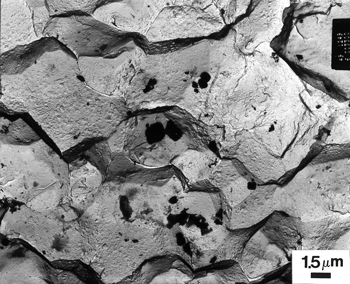
This writer experienced another problem where the SEM was not satisfactory. Failures of Co-free maraging steel mobile-assault bridges occurred in the field. The fracture origin was intergranular, but the SEM could not detect any grain boundary phases, Figure 1. All regular failure mechanisms for producing intergranular fractures were ruled out. Since it is well known that maraging steels can be embrittled by precipitation of MC-type carbides during cooling after hot working, extraction fractographs were made and viewed by TEM. This revealed numerous TiC precipitates on the intergranular fracture which were not visible in the SEM fractographs, Figure 2. Again, there was insufficient atomic number contrast to see these precipitates against the matrix.
In corrosion and oxidation studies, it may be difficult to see some thin films on fracture surfaces. This is more of a problem at high kV’s than at low potentials. So, just because the operator does not see anything on a fracture, that doesn’t mean that nothing is present! One must be careful recognizing that potential imaging problems can occur. Always examine fractures with a stereomicroscope before doing SEM work.
| Intergranular Cracking in Ni-Base Alloy | |
 |
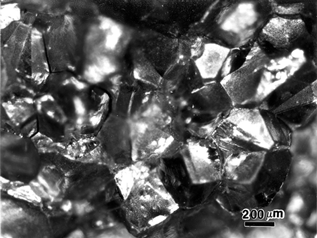 |
| Figure 4: Examination of fractures can be done with the LOM or a stereomicroscope at low to medium magnifications, depending upon the surface flatness, as demonstrated by the bright field (left) and dark field (right) images of the intergranular fracture of a Ni-based superalloy. |
|
Good failure analysis work had been done prior to the development of the SEM. Introduction of the SEM has made fracture examination simpler, and EDS adds a unique ability to analyze the composition of features on fractures. However, some of the good practices used by failure analysts prior to the SEM are often not done or done poorly now. For example, examination of the fracture profile, and of secondary cracks (metal present on both sides of the crack), is extremely informative allowing the observer to define the fractures mode and detect features in the structure associated with the crack, as demonstrated by the example in Figure 3 for the Co-free maraging steel fracture surface shown in Figs. 1 and 2. Edge retention is important for such work, and nickel plating of the fracture may be required. Visual examination of fractures, which also will identify the fracture mode, is crucial to failure analysis as the fracture origin will be found by eye. The SEM is just one of many tools that the analyst uses to solve failure problems.
The Scanning Electron Microscope is a relatively young instrument. The theories pertaining to secondary electron emission from surfaces originate with M. Knoll in 1935. Manfred von Ardenne built the first SEM in 1937. The next working SEM was created in 1938 by work at the University of Toronto by Cecil Hall, James Hillier and Albert Prebus under Eli Burton. This work lead to the first commercial SEM in the US, the Model B, by V.A. Zworykin, J. Hillier, and R.L. Snyder of RCA in 1942, although its signal-to-noise ratio was excessive. The very first commercial SEM was developed by Ernst Ruska of Siemens in Germany in 1938. In 1960, Everhart and Thornley developed an improved electron detector, followed by the developments of Crewe in 1963, which lead to the first commercially produced SEM, the Stereoscan, of Sheward and Snelling in 1965. The first use of an SEM was described in a 1959 publication by Tipper, Dagg, and Wells. Prior to the commercial introduction of the SEM, a number of papers were published describing fractography research with the SEM, particularly of fatigue fractures. Within about five years of its introduction, the SEM had become the most popular, most widely used, and most powerful tool for fractography research.
| Intergranular Fracture in Ni-Base Alloy | |
 |
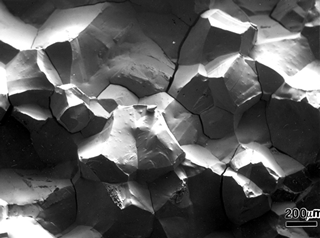 |
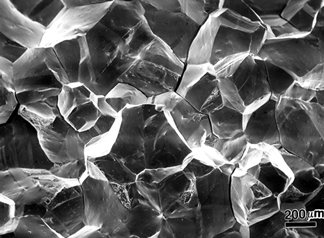
| Figure 5: SEM SEI (left) and E-T BSE (right) images of the intergranular fracture shown in Figure 4. Note that the fracture topography is easier to interpret using the E-T BSE image. |
|
The chief advantage of the SEM over the light microscope is its much greater depth of field, typically two orders of magnitude better than the light microscope at the same magnification. As with the light microscope, the depth of field of the SEM decreases with increasing magnification. If the final aperture size is made smaller, the aperture angle is decreased which produces a smaller beam size and greater depth of focus. Decreasing the aperture from 300µm to 100µm produces about a three-fold increase in the depth of field.
While the SEM can achieve better resolution than the light microscope, a great deal of fractography work is done at magnifications achievable with the light microscope. Except for fatigue striation work, SEM fractographic observations are usually under 1000X. In such work, the resolution is no different than can be achieved by the light microscope. Only when the magnification exceeds 1500X does the SEM provide improved resolution.
One of the virtues of the SEM and one reason for its rapid acceptance is that the fractographs resemble what is seen by light microscopy. TEM replicas are more difficult to interpret because of replica defects and the fact that a replica flattens a bit compared to the actual image. This flattening is somewhat useful when measuring fatigue striations.
There are several operational modes for forming images. The most commonly used mode is the emissive mode due to low-energy secondary electrons emitted from the specimen to a depth of about 10 nm. Contrast stems from topographic differences; that is, surface roughness alters the production of secondary electrons. This is the most commonly used mode for examining fractures. Contrast is further enhanced by tilting the specimen relative to the beam. While contrast is improved, tilting influences the apparent spacing of features and causes the magnification to vary across the tilt axis. Image distortion also occurs although this can be corrected electronically.
|
Fatigue-Intergranular Interface in an X-750 Rising-Load Test Specimen
|
|
 |
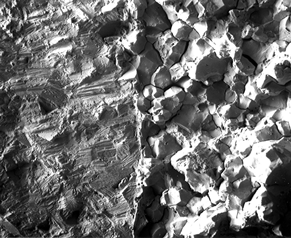 |
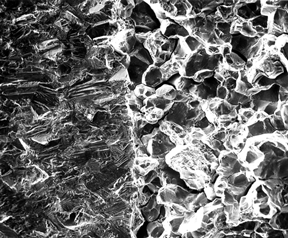
| SEM SEI, 13 mm WD, 4°Tilt | SEM ET-BSEI, 13 mm WD, 4°Tilt |
| Figure 6: SEI (left) and E-T BSE (right) images of the interface between the fatigue pre-crack (left side of fracture) and the intergranular test fracture (right side of fracture) in a rising-load test specimen of X-750 Ni-base superalloy. |
|
Another operational mode, called the reflective mode, uses the high energy back-scattered electrons which come from a substantial depth up to a few micrometers. Although the achievable resolution using back-scattered electrons is less than with secondary electrons, it is of the same approximate level as achieved with the light microscope. A line-of-sight orientation of the fracture to the detector is important in this mode. For examining fractures, the detection of back-scattered electrons with the Everhart-Thornley detector offers excellent images as the shadow effects seen in this mode more closely simulates light microscope images. The shadow effects in this mode render the three-dimensional fracture images much better than secondary electron images.
Figure 4 shows bright field and dark field images of a coarse intergranular fracture in a nickel-based superalloy. Note that one can tell that the fracture is intergranular even though a good portion of the images are not in focus. Figure 5 shows a SEM secondary electron image of this fracture and an E-T backscatter image of the same area. Many people have difficulty in understanding the fracture surface morphology with the SEI. While the resolution of fine detail is not as good in the E-T BSE image, the fracture topography is much easier to interpret, even for an experienced person. As a final example of the fracture differences between the SEI and the E-T BSE image, Figure 6 shows SEI and E-T BSE views of the interface between the fatigue pre-crack zone (left side of fracture) and the intergranular test fracture (right side) in an X-750 rising- load test specimen.
George Vander Voort has a background in physical, process and mechanical metallurgy and has been performing metallographic studies for 47 years. He is a long-time member of ASTM Committee E-4 on metallography and has published extensively in metallography and failure analysis. He regularly teaches MEI courses for ASM International and is now doing webinars. He is a consultant for Struers Inc. and will be teaching courses soon for them. He can be reached at 847-623-7648, EMAIL: georgevandervoort@yahoo.com and through his web site: www.georgevandervoort.com
To View a listing of all George’s articles please click here
Read George Vander Voort’s Biography

