When I worked for Carpenter Technology Corporation in their research center, we encountered several cases where chart ratings of specimens by their production lab yielded grain size ratings between 4 and 5 for a number of specimens on an order (these orders required tests on 20 specimens from different bars). When we re-tested them in the R&D center, we got similar chart ratings. But, when we actually measured the grain size, all ratings were between 5 and 6 on the ASTM E 112 scale. As the criterion for pass/fail was a grain size of 5 or finer (higher), this bias was important. Consequently, at a subsequent ASTM E-4 committee meeting, I conducted a “round robin” test. I took two specimens of different ferritic stainless steels and etched them electrolytically with 60% HNO3 at about 1 V dc for 1 to 2 minutes, which revealed the grain boundaries about as perfectly as possible. This was in the days of film photography. I took 4 x 5” negatives of both specimens at various magnifications: 50, 100, 200 and 500X. I then made 8 x 10” enlargements of each negative. I took these to the next E-4 meeting.
A number of ASTM E-4 members counted intercepts using the three-circle grid and then counted the grains within a test circle, and intersecting the test circle, on seven micrographs. Three were at different magnifications for a ferritic stainless steel and four were at different magnifications for another ferritic stainless steel. All images were taken from the same region. The people did not calculate the grain size; they only collected the raw data. Prior to that, they used a comparison chart, plate I of E 112, to estimate the grain size of each micrograph.
A few people later digitized the images and measured the grain size with image analysis systems. Random grid placement was used for the intercept method, but for the planimetric method, the template contained five test circles, so the placement on the micrograph was not completely random, but forced. I calculated the grain sizes for each person’s tests as I did want them to do so, as they might go back and change their chart ratings.
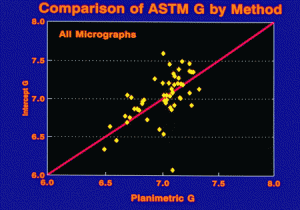
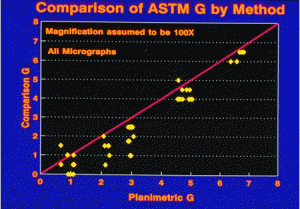
This work revealed a distinct bias between the chart ratings and actual measurements, both planimetric and intercept. There was no bias at all between the two measurement methods, the Jeffries planimetric method versus the Heyn-Hilliard-Abrams intercept method, as shown in the accompanying plots.
George Vander Voort has a background in physical, process and mechanical metallurgy and has been performing metallographic studies for 45 years. He is a long-time member of ASTM Committee E-4 on metallography and has published extensively in metallography and failure analysis. He regularly teaches MEI courses for ASM International and is now doing webinars. He is a consultant for Struers Inc. and will be teaching courses soon for them. He can be reached at 1-847-623-7648, EMAIL: georgevandervoort@yahoo.com and through his web site: www.georgevandervoort.com
To View a listing of all George’s articles please click here
Read George Vander Voort’s Biography


