Cold working is well known to change the properties of metals and alloys. Deformation increases the strength of metals but usually reduces it toughness and leads to anisotropy of properties, that is, directionality. Hot working also produces similar affects, the microstructural results after hot work with low finishing temperatures may appear to be the same as from cold working. Hot rolling of shapes, plate or bar, for example, elongates the nonmetallic inclusions in the deformation direction, which will reduce the isotropy of mechanical properties. Hot working can also lead to segregation being elongated parallel to the deformation direction, which also reduces isotropy. Reducing the finishing temperature, that is, the temperature of the steel at the last deformation pass, will promote “banding” – parallel alignment of the constituents into layers, such as alternate bands of ferrite and pearlite. This also promotes anisotropy of mechanical properties, chiefly toughness and ductility. Strength is not usually affected to a significant degree by banding, compared to toughness and ductility. In single phase metals and alloys, the grains will become elongated due to cold working. In hot working, the grain shape may not be equiaxed upon cooling if the finishing temperature is not high enough to promote complete recrystallization upon cooling to ambient temperature.
Many years ago as a novice engineer, I was instructed to examine the grain size of steels on a transverse plane. After thinking about that a bit, I realized that this instruction could lead to serious errors in rating the grain size of steel if the shape was not equiaxed. I started preparing longitudinally oriented specimens and soon discovered that all specimens coming into the laboratory did not have equiaxed grains. On a transverse plane the apparent grain size was equiaxed and small while on the longitudinal plane, if the grains were not fully recrystallized, they would be elongated and larger in apparent size. Think of what the cross section of a cigar would look like if you cut one plane perpendicular to the length and the other parallel to the length – you would have a vast difference in shape and size.
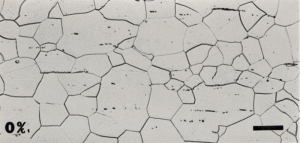
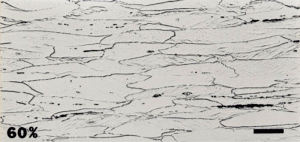
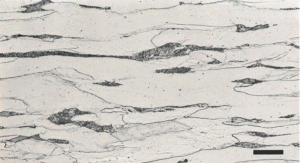
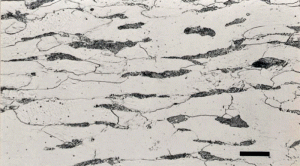
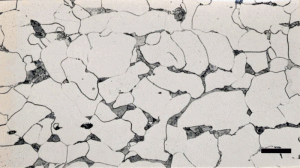
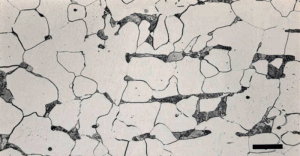
In this series, I have discussed grain size measurement twice but not grain shape. The simplest way to evaluate grain shape is to measure the length and width of a large number of grains, calculate the anisotropy ratio of each grain, and then calculate the average anisotropy ratio. If the specimen has been annealed, normalized, or slow cooled from a “high” finishing temperature after hot working, the anisotropy ratios should be very close to 1. Figure 1a shows a very low carbon content sheet steel in the annealed condition with equiaxed grain shapes while Figure 1b shows the same steel after cold reduction by 60% of the thickness with highly elongated grains. Both planes are longitudinal. Figures 2 and 3 show the affect of altering the “finishing” temperature, the steel temperature at the last hot deformation pass, upon the ferrite grain shape. Both transverse and longitudinal planes are illustrated showing that the grain shape with the very low finishing temperature is like a pancake, while at the higher finishing temperature, they are equiaxed in shape on both planes. But, there is quite a bit of similarity in these structures.
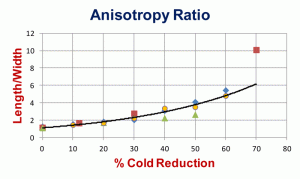
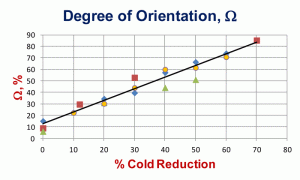
Mean anisotropy ratios, the average of many measurements of the length/width of ferrite grains, for three different sets of low-carbon sheet steels are shown in Figure 4. In general, the shape variations are quite similar at all degrees of deformation. Two of these sets were cold reduced up to 90% in thickness, but revealing the grain boundaries at reductions of 70% or above is difficult, especially using nital as the etchant. Figure 5 shows the “degree of orientation,” Ω, using Underwood’s terminology [1] for these three sets of data. To perform this measurement, we make measurements of the number of grain boundary intersections per unit length (usually per mm), PL, in the longitudinal and transverse directions, PL║ and PL┴, respectively, on a longitudinally oriented plane-of-polish with respect to the deformation axis. To calculate the degree of orientation, Ω, using these PL values in the following equation:
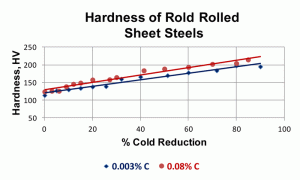
The degree of orientation reaches a high value by 60-70% cold reduction. Figure 6 shows the increase in hardness from the annealed state to a cold reduction of 90%. BCC metals, like carbon sheet steels, do not work harden as strongly as FCC metals, which have more operative slip systems.
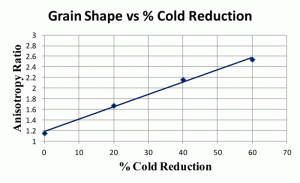
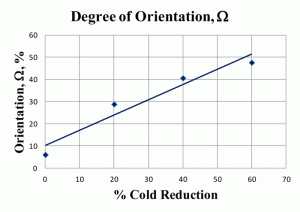
Figure 7 shows anisotropy ratios for another low-carbon steel in the annealed condition and after reductions of 20, 40 and 60%. This steel had a slightly higher carbon and alloy content than the two steels with 0.003 and 0.08% carbon shown previously. The anisotropy ratios are not as high. Figure 8 shows the degree of orientation, Ω, for these same four specimens of low-carbon steel. Again, these values are somewhat lower than those for the 0.003 and 0.08% C sheet steels described previously.
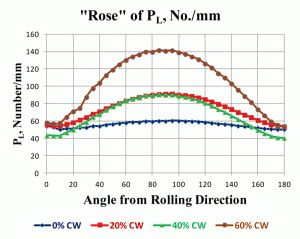
As a final note on how grain anisotropy can be illustrated, Figure 9 shows the “rose of the PL values” for these four low-carbon steel specimens where PL has been measured every 5° from 0°, parallel to the longitudinal axis, through 90°, perpendicular to the longitudinal axis, and back to 180°, parallel to the longitudinal axis. The “rose of the PL values” graphically illustrates the change in grain shape as a function of deformation very nicely.
George Vander Voort has a background in physical, process and mechanical metallurgy and has been performing metallographic studies for 45 years. He is a long-time member of ASTM Committee E-4 on metallography and has published extensively in metallography and failure analysis. He regularly teaches MEI courses for ASM International and is now doing webinars. He is a consultant for Struers Inc. and will be teaching courses soon for them. He can be reached at 1-847-623-7648, EMAIL: georgevandervoort@yahoo.com and through his web site: www.georgevandervoort.com
To View a listing of all George’s articles please click here
Read George Vander Voort’s Biography

