Abstract
Aside from the well-known grain size measurement techniques using either the planimetric methods of Jeffries or Saltykov, or the intercept method of Heyn, Hilliard and Abrams, one can measure the grain size through a count of grain-boundary triple point intersections within a known area through the use of Euler’s law. This technique has rarely been used but it should be possible to do such a count by image analysis. In general, measurements based on point counts (0 dimensional) are less subject to errors than lineal measurements (one-dimensional) which are less subject to error than areal measurements (two-dimensional).
Triple-Point Count Method
A circle of known size is drawn on a photograph or a transparency that is placed over the image. The number of grain-boundary triple points, P, within the test area is counted. If a four-grain edge junction is observed, which is much less common, it is counted as two. The number of grains per unit area, NA, is calculated from:
where AT is the test area at 1X. The ASTM grain size, G, is calculated in the usual way from NA using:
G = (3.322 log NA) – 2.95 (2)
Experimental Program
Two images of a ferritic stainless steel, etched electrolytically with aqueous 60% nitric acid, were used for the experiments. The magnifications were 100 and 400X and they were located centered at the same area. The microstructural grain structure images were printed at a variety of sizes on paper and circles of different sizes were superimposed over the images to generate a very wide variation in counts (P varied from 5 to 860). The triple points were coded as counted to avoid missing some or counting some twice.
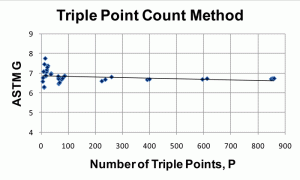
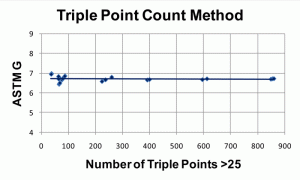
Figure 1 shows a plot of all 41 measurements of P, ranging from 5 to 860. The linear curve fit reveals a slight downward trend with increasing P. Significant data scatter is observed for counts <25 with a range in G from 6.25 to 7.75. Figure 2 shows the data for P >25, where there is little data scatter and a flat, constant trend line for P versus G. The range of G was 6.44 to 6.98. The mean grain size for all 41 measurements was 6.82 and for those counts >25, the mean G was 6.72.
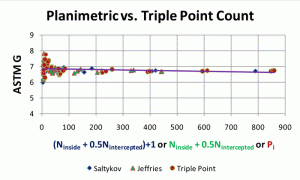
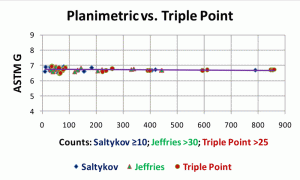
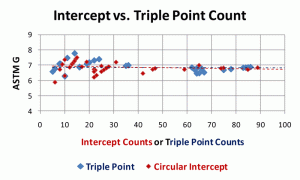
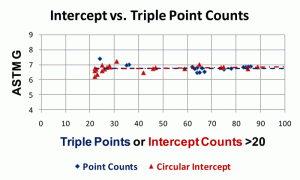
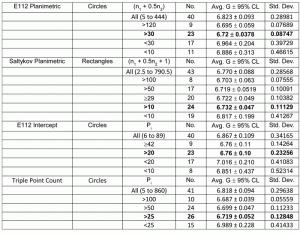
Figures 3 and 4 compare the ASTM grain size determined by the triple-point count method and the grain size determined by the planimetric methods of Saltykov, using rectangles, and the E 112 method of Jeffries, using circles. Figure 3 shows all of the data by the three methods and the linear curve fit shows excellent agreement between the three methods. Figure 4 shows the data for grain counts by the Saltykov method ≥10, for the Jeffries method >30 and for the triple-point count method >25. The agreement between the results is superb. Figures 5 and 6 compare the triple-point count results with the E 112 intercept count results using a single circle. Figure 5 shows all of the data plotted and the two linear fit lines are identical. The data scatter is high for counts <30. Figure 6 shows the comparison for counts >20. The results again are identical. For Figures 5 and 6, the triple-point counts above 90 were not plotted as there were no intercept counts above 89. Table 1 shows data comparing the four test methods as a function of counts.
Conclusions
The triple-point count method is easy to use, but does require marking of the grain boundary intersections to obtain an accurate count. The ASTM grain size determined by the triple-point count method agreed perfectly with the results from the planimetric methods of Saltykov and Jeffries and with the Heyn/Hilliard/Abrams intercept method.
George Vander Voort has a background in physical, process and mechanical metallurgy and has been performing metallographic studies for 45 years. He is a long-time member of ASTM Committee E-4 on metallography and has published extensively in metallography and failure analysis. He regularly teaches MEI courses for ASM International and is now doing webinars. He is a consultant for Struers Inc. and will be teaching courses soon for them. He can be reached at 1-847-623-7648, EMAIL: georgevandervoort@yahoo.com and through his web site: www.georgevandervoort.com
To View a listing of all George’s articles please click here
Read George Vander Voort’s Biography

