Abstract
 |
|
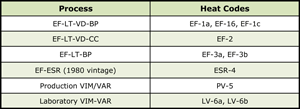
Table 1. Test Material Studied
|
Over the past forty-plus years, steelmakers have introduced improved practices for reducing the inclusion content of steels. The success of these practice changes can be monitored in a variety of ways. Chemical analysis of the bulk sulfur and oxygen contents provides a relatively simple means to assess the impact of these changes. However, microscopical test methods are still needed to assess the nature of the inclusions present. Traditional chart-based measurement methods have wide acceptability, and their data are well understood by both purchaser and producer for heat acceptance purposes. These methods do have inherent weaknesses which limit their usefulness for quality control, SPC, and database applications. Image analysis-based chart measurements are an improvement over manually generated chart ratings, but the data still does not lend itself to databases and statistical comparisons. ASTM Committee E-4 on Metallography has developed a stereologically-based image analysis standard test method, E 1245, which provides the necessary data in a form which is easily databased and analyzed statistically. The presentation will describe E 1245 and show how data from different heats and melting practices can be compared statistically to ascertain valid test differences.
Introduction
The comparison chart method has been the traditional approach for rating the inclusion content of steels. The ASTM E45 (1) and ISO 4967 (2) chart methods as well as several other national standards are based on the original Swedish JK Chart methods (3). A somewhat different chart method (4) is used in Germany as VDEh 1570 or DIN 50602. While chart methods have been used for more than sixty years and are still widely used, they do suffer from a number of problems (5). Steelmaking practices have changed over the years with considerable diversity in deoxidization practices which influence the nature of the inclusion population. The original charts, developed using acid open-hearth steel, do not adequately reflect the appearance of inclusions in today’s steels. The chart picture gradings, relative to the severity values, have been inaccurate. (The newly adapted ASTM E45 chart addresses this problem.) Numerous inter-laboratory rating studies have shown that inclusion chart ratings suffer from poor repeatability and reproducibility. Chart data has a limited number of severity values thus limiting sensitivity and ability to discriminate between heats. The worst field method is easiest to perform but is qualitative at best, while the quantitative method (every field within a fixed area is rated) is very tedious, and the data are very cumbersome to handle. In either case, the qualitative or quantitative methods, the data are ill-suited for use in spreadsheet-type databases.
Recognizing these problems, many people have tried to develop modified chart methods or alternate counting/measurement schemes (5). None of these have been adapted by industry. There are two major obstacles to the adoption of a new inclusion rating system. First, the steel purchaser or designer has no familiarity with the data produced by the new method, so they do not know what acceptance limits should be specified. Secondly, the steelmaker also has no familiarity with data from the new system, so they do not know if they can meet the specified limits. Only by rating numerous hearts of steel by the chart method and the new method, with the data openly published, can this problem be resolved.
Consequently, the write decided to try to improve the chart method by using automatic image analysis (6) and wrote ASTM E1122, adopted initially in 1986 (7). However, to address some of the other problems such as the redefinition of the inclusion measurement values for specific severity levels, other changes (8) to both E1122 and E45 were proposed, balloted, and adopted.
Over the years, many people have used stereological procedures (5) chiefly point-counting to define the volume fraction to determine the inclusion content. When image analyzers became more powerful and more common in the laboratory in the 1980s, the writer prepared ASTM E1245 (9) which was adopted in 1988. As computer power has increased, E1245 has been modified. The original method used field measurements exclusively, while the current version combines field measurements and feature-specific measurements. The next modification will incorporate a statistical approach to predict the largest inclusion. A few examples of the nature and use of E1245 data have been published (10 – 12).
In this method, oxides and sulfides are separated by gray level differences, and the following measurements are made separately for sulfides and oxides in each specimen.
- Area fraction (estimate of the volume fraction) usually expressed as a percentage, AA.
- Number of inclusions per unit area (MM2), NA
- Average inclusion length (μm), L
- Average inclusion area (μm2), A
- Mean free path, the mean edge-to-edge spacing between all inclusions in the through-thickness direction (μm), λ or MFP
The mean free path is not a nearest neighbor spacing. It is calculated according to:
where the area fraction is a fraction (not a percentage), and NL is the number of interceptions of inclusions with lines parallel to the through thickness direction. On older image analyzers, the scan lines were used, but on current image analyzers the frame grabber rows are used. However, because of the nature of this equation, λ cannot be calculated for each field if any are inclusion free. Hence, except for sulfides in free-machining steels, λ is normally calculated only after a number of fields are measured; i.e., at the end of the analysis run. Otherwise, AA and NA are field measurements, and the mean and standard deviation of the measurements are calculated after the analysis run. L and A are based on the mean of the individual inclusion measurements rather than a mean of the mean length or mean area per field. Consequently for each analysis run, the mean and standard deviations of AA, NA, L, and A are determined, but only a mean λ value is determined. If there are no blank fields, λ can be calculated for each field, and the mean and standard deviation could be calculated for that analysis run.
If each specimen in the heat lot is evaluated using E 1245, then the mean values for each specimen can be used to calculate the heat mean and standard deviation. This brings up a practical mathematical problem. Strictly speaking, as the area fraction drops below 2%, the distribution of any field measurement deviates from a Gaussian distribution, and it is not valid to calculate an arithmetic standard deviation. However, correcting this problem is so difficult that standard deviations are still calculated. However, the distribution of specimen averages for a larger number of specimens from a heat lot is Gaussian. Consequently, the arithmetic standard deviation of specimen mean values is valid. This is good as many times we want to compare data for different heats of steel, and we need the heat mean and standard deviation (plus the number of specimens measured).
The purpose of this paper is to compare chart ratings made by ASTM E45/E1122 with stereological E1245 data. The test bearing steel is made by different manufacturers using a variety of steelmaking procedures.
RESULTS
Test Material
For this study, longitudinally-oriented surfaces were prepared from the mid-thickness location of billets and bars of a variety of heats of 52100. In most cases, the specimens came from the usual top, middle, and bottom locations with respect to the cast ingot, but in a few cases they came from opposite ends of the bars selected randomly.
Electric furnace steel came from three sources. Source 1 provided test material from three heats produced within a short time frame – heats 1a, 1b, and 1c. These electric furnace heats were ladle treated, vacuum degassed, and bottom poured. Source 2 provided material from one heat that was electric furnace melted, ladle treated, vacuum degassed, and concast – heat 2. Source 3 provided material from two heats that were electric furnace melted, ladle treated, and bottom poured – 3a and 3b.
The next material heat, ESR-4, was electric furnace melted and then electroslag remelted. These samples were taken from adjacent locations from the same bar. This steel was processed around 1980 and was used in an earlier inter-laboratory manual rating study. It may not be representative of today’s ESR technology.
Samples from a production double vacuum melt VIM/VAR heat (vacuum induction melt, vacuum arc remelt) and one 500 lb. laboratory VIM/VAR heat were tested, PV-5 and LV-6, respectively. Hence, these heats cover the range of 52100 used in bearing steels today.
 |
|
Table 2. Heat Averages for E45/E1122 Data
|
Measurements
The specimens were polished on longitudinal cross-sections after hardening the specimens (to provide optimum inclusion retention). Automatic polishing equipment was used starting with a coarse grit SiC paper to remove cutting damage and make the surfaces of the specimens co-planar. Next, they were ground using 15 μm diamond slurry on a heavy nylon cloth. Then, they were polished using 3 μm diamond on a DP-Pan cloth followed by final polishing using colloidal silica on an MD-Floc polishing cloth.
Image analysis measurements were performed using 200 randomly selected fields per specimen for ASTM E1245 while 160 mm2 surface area was evaluated per ASM E1122. Table 2 lists the heat averages for the JK data based on the averages of the worst field ratings for all of the specimens in each heat. One problem with worst field ratings is immediately apparent but only if the number of worst fields per specimen is known to the reader. Note that six of the nine heats have ratings for C-type inclusions of both thicknesses. However, each specimen had only a few such fields with C ratings. Such ratings generally arise in these heats when B-type oxides are touching so that their net length meets the C requirement. Manual raters would probably call these B inclusions despite their contiguous nature. The primary weakness of the JK data shown in Table 2 is that it is not quantitative. It only shows what the rating of the worst field was. It is difficult to use this data to clearly discriminate between heats.
 |
 |
|
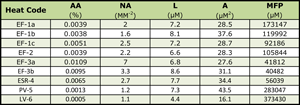
Table 3. Heat Averages for Oxides by E1245 |
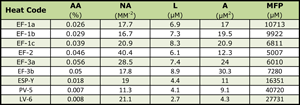
Table 4. Heat Averages for Sulfides by E1245 |
Tables 3 and 4 show the E1245 oxide and sulfide data. Bear in mind that the standard deviations and number of specimens for each value are also known but not reported here. The oxide data is more informative for comparing the heats as the aim sulfur contents of these heats may be quite different; that is, while the steelmaker always wants the lowest possible oxygen content, that may not be the case for the sulfur content. However, the sulfide data is provided for comparison with the JK A-type (sulfide) ratings.
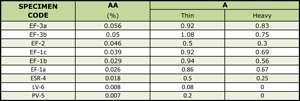
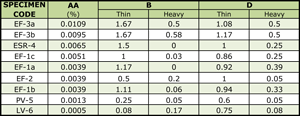
Table 5 shows the heats ordered by area fraction of sulfide inclusions and the corresponding JK ratings for the A-type (sulfide) inclusions. In general, there is a reasonable correlation between the JK ratings considering both the thin and thick ratings and the sulfide area fractions. The major exception is heat EF-2 where the JK ratings were much lower than would be expected. Further, PV 5 and LV-6 had essentially identical area fractions, but the A-thin ratings differed significantly.
 |
 |
|
Table 5. Ranking by Sulfide Area Fraction |
Table 6. Ranking by Oxide Area Fraction |
Table 6 shows the heats ordered by area fraction of oxide inclusion and the corresponding JK ratings for the B- and D-type inclusions. The C-type inclusions were not included for the reason noted above. Considering only the thin ratings, there is general agreement that the first three heats used had the highest oxide content while the last two heats had the lowest inclusion content. In between, the agreement is not as good. The heavy ratings are more erratic than the thin ratings. One could conclude that worst field JK ratings are suitable for discriminating between heats with substantial differences in inclusion content and perhaps less than adequate for separating heats with small differences in the inclusion content.
The inclusion ratings suggest that, of the electric furnace heats, the new EF-1 heats were similar to the EF-2 heat and both had lower inclusion contents than the two EF-3 heats. The E1245 data can be used to compare these heats. A few examples of such comparisons will be presented to illustrate the value of true quantitative data.
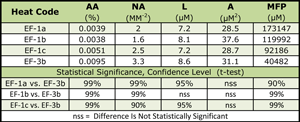
Table 7 repeats the E1245 oxide data for the three EF-1 heats and EF-3b. The T-test was used to determine if the difference between the means is statistically significant. For example, Table 7 shows that the oxide area fraction of heat EF-3b is higher than that of the three EF-1 heats and that these differences were significant at the 99% confidence level. On the other hand, the analysis showed that there was not statistical difference among any of the area values. The mean free path comparison reveals an interesting fact. Note that he MFP value of EF-1a was the largest, yet the statistical significance of the difference between the MFP of EF-1a and EF-3b was lower than that of the other two heats relative to that of EF-3b. At first glance, this seems to be wrong. However, the standard deviation of the MFP of EF-1a was six times greater than that of EF-1b and EF-1c which accounts for the lower confidence level.
 |
 |
|
Table 7. Comparison of Oxides: EF Heats 1A, B, AND C Versus Heat 3B |
Table 8. Comparison of Oxides: EF Heats 3A AND 3B Versus Heat PV-5 |
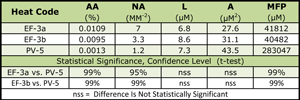
As a second example, Table 8 shows a comparison of the oxide measurements in electric furnace heats EF-3a and EF-3b and VIM/VAR heat PV-5. Here the area fraction, number per unit area, and mean free path values for the production VIM/VAR heat are clearly lower than the corresponding values for the EF heats, and the differences are strongly significant. However, in the NA values, we again see an apparent discrepancy. The difference between PV-5 (1.2) and EF-3a (7.0) is less significant than the difference between PV-5 and EF-3b (3.3). The reason for this apparent anomaly again lies with the standard deviations, that of EF-3a is more than 8 times larger than that of EF-3b (and 10 times larger than that of PV-5). Note that the differences between the L and A values are not statistically significant. This is true even for the area values where there appears to be an obvious difference. Again, these differences are not statistically significant due to the magnitude of the standard deviations.
Conclusions
Chart ratings of inclusions have limited value. Today, performing them by image analysis does yield better reproducibility. But, the data is not statistical and it is difficult to compare heats made by the same or by different melting practices. The E1245 method has the advantage of being performed using stereological type measurements, although only one plane is evaluated. But, the data per specimen and per heat is quantitative and can be compared mathematically to determine if one process is better or worse than another. Heat data can be collected into spreadsheets to follow melting practice changes and results. But, the problem now exists that despite the publication of results using E1245, purchasers are unaware of the method and have not created purchase requirements using the method, except for a few products. That is needed to get the standard implemented commercially, as opposed to being mainly a research tool.
References
- ASTM E45: Standard Test Methods for Determining the Inclusion Content of Steel.
- ISO 4967: Steel-Determination of Content of Non-metallic Inclusions – Micrographic Method Using Standard Diagrams.
- B. Rinman, et al., “Chart for the Estimation of Inclusion in Steel,” Jernkontoret Annal., Vol. 120, 1936, pp. 199 – 226.
- Barteld, K. and A. Stanz, “Microscopic Examination of Specialty Steels for Non-metallic Inclusion with Reference Inclusion Charts,” Archiv für das Eisenhuettenwesen, Vol. 42, August 1973, pp. 581 – 597.
- Vander Voort, G. F., “Inclusion Measurement,” Metallography as a Quality Control Tool, Plenum Press, NY, 1980, pp. 1 – 88.
- Vander Voort, G. F., and F. Golden, “Automating the JK Inclusion Analysis,” Microstructural Science, Vol. 10, 1982, pp. 277 – 290.
- ASTM E1122: Standard Practice for Obtaining JK Inclusion Ratings Using Automatic Image Analysis.
- Vander Voort, G. F., and R. K. Wilson, “Nonmetallic Inclusions and ASM Committee E-4”, ASTM Standardization News, Vol. 19, May 1991, pp. 28 – 37.
- ASTM E1245: Standard Practice for Determining the Inclusion or Second-Phase Constituent Content of metals by Automatic Image Analysis.
- Vander Voort, G. F., “Measurement of Extremely Low Inclusions Contents by Image Analysis”, ASTM STP987: Effect of Steel Manufacturing Processes on the Quality of Bearing Steels, ASTM, Philadelphia 1988, pp. 226 – 249.
- Vander Voort, G. F., “Characterization of Inclusions in a Laboratory Heat of A1S1 303 Stainless Steel,” Inclusions and Their Influences on Material Behavior, ASM International, 1988, pp. 49 – 64.
- Vander Voort, G. F., “Computer-aided Microstructural Analysis of Specialty Steels,” Materials Characterization, Vol. 27, No. 4, December 1991, pp. 241 – 260.
George Vander Voort has a background in physical, process and mechanical metallurgy and has been performing metallographic studies for 45 years. He is a long-time member of ASTM Committee E-4 on metallography and has published extensively in metallography and failure analysis. He regularly teaches MEI courses for ASM International and is now doing webinars. He is a consultant for Struers Inc. and will be teaching courses soon for them. He can be reached at 1-847-623-7648, EMAIL: georgevandervoort@yahoo.com and through his web site: www.georgevandervoort.com
To View a listing of all George’s articles please click here
Read George Vander Voort’s Biography
