Decarburization occurs when carbon atoms at the steel surface interact with the furnace atmosphere and are removed from the steel as a gaseous phase (1-8). Carbon from the interior will then diffuse towards the surface, that is, carbon diffuses from a region of high concentration to a region of low concentration to continue the decarburization process and establish the maximum depth of decarburization (MAD). Because the rate of carbon diffusion increases with temperature when the structure is fully austenitic, the MAD will increase as the temperature increases above the Ac3. For temperatures in the two phase region, between the Ac1 and Ac3, the process is more complex. The diffusion rates of carbon in ferrite and in austenite are different and are influenced by temperature and composition.
Decarburization is a serious problem as the surface properties will be inferior to the core and will result in poor wear resistance and low fatigue life. There are two characteristics that may be present at the surface of a decarburized steel that can be measured: the free-ferrite (FFD) layer depth (when present) and the partial decarburization depth (PDD) (when free-ferrite is not present). If free ferrite is present, we generally measure the depth of the free-ferrite layer (which is often quite variable) plus the depth of partial decarburization to the unaffected core. This total, FFD + PDD, is called the maximum affected depth, or MAD. These depths are not uniform and can vary substantially, leading to measurements of the average FFD, average PDD and average MAD, as well as maximum values for each. ASTM E1077 covers the measurement of decarburization.
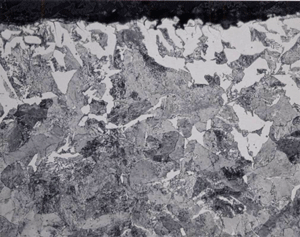
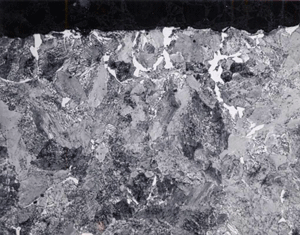
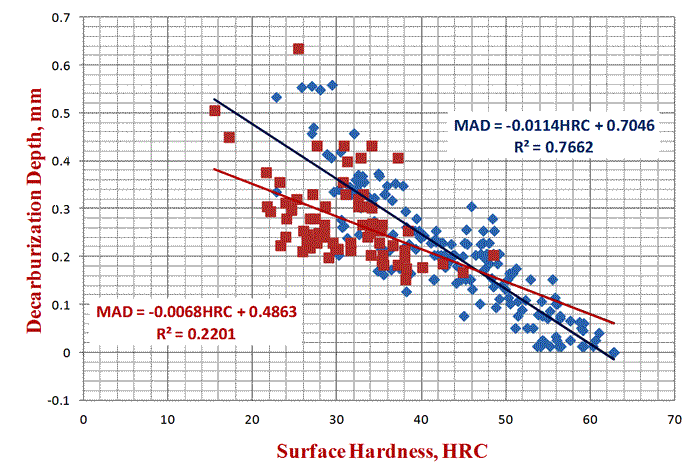
In practice, decarburization should be evaluated on a plane transverse to the hot working axis, as the variation in depth will be greater going around the bar on the transverse plane than along a constant position along a longitudinal plane. The depth of decarburization can vary substantially around the periphery of a bar, as shown in Figure 1. Corners of square or rectangular sections normally exhibit greater depths of decarburization than planar surfaces. Numerous techniques can be used to measure decarburization. A simple screening test can be performed just be taking hardness tests on the scale-free surface, as shown in Figure 2. If we have a round bar, it can be centered on a lathe and turnings can be taken incrementally, generally every 0.005 inch, and then chemically analyzed by traditional methods. But, this is basically a research tool, too expensive for production testing. Visual light microscopic ratings can be made on a properly polished cross section. In this work, edge retention must be perfect, that is, the surface must be perfectly flat to the extreme edge. If edges are rounded, the exact location of the outer surface is difficult to define with precision and depth measurement accuracy suffers. Good edge retention requires mounting of the specimen in a resin that will not exhibit shrinkage gaps between the mount and the specimen after curing. Grinding and polishing procedures must emphasize maintaining flatness. Low-nap or napless cloths are used. Microindentation hardness traces can also be used to define the MAD, but are generally not as useful in determining the FFD.
Visual LOM measurements may be “qualitative” or “quantitative.” Qualitative ratings are often performed by mill metallographers. The rater scans the edge of the specimen looking for areas that appear to be typical of an apparent average or the deepest penetration. Qualitative measurements can be subjective and biased. For quantitative measurements, the rater makes at least 25 measurements at randomly chosen locations spaced around the cross section. The larger the cross section, the greater the number of measurements. Here, the rater does not try to select regions that appear to be “typical” or the “worst.” Quantitative measurements are more reproducible than qualitative measurements and should be unbiased if the measurement location is done randomly. In most cases, a reticule is used to make the measurement. Alternatively, many software programs for capturing images allow the operator to make point-to-point distance measurements. These systems must be properly calibrated. Automated image analysis measurements may also be performed but recognition of the location where the carbon content becomes constant may be a challenge depending upon the microstructure, etchant used and the carbon content of the core.
Hot working temperatures can produce ferrite at the surface with the amount and size of the ferrite grains increasing with increasing loss of carbon at the surface. The upper critical temperature, Ac3, of these grains could be above 1600°F, as the alloy composition (spring steels will be used as an example) and residual elements influence the Ac3 of the steel grade. If a decarburized specimen is induction hardened, the heating rate to the austenitization temperature is extremely fast. To put all of the carbon in solution (assuming that the steel has a carbon content of 0.6-0.65 %), it is heated to ~1700-1750°F. As the holding time is quite short, perhaps no more than 30 s, there is little time for appreciable carbon diffusion and the decarburization depth after heat treatment is a function of the as-rolled mill decarburization depth.
If spring steels (typically ~0.6% carbon) are heat treated in gas-fired furnaces, the operating conditions can either increase or decrease the depth of decarburization after heat treatment, relative to the starting, as-rolled depth of decarburization. Austenitizing of these grades is performed usually in the range of 1600-1650°F and holding times, which depend upon the bar diameter, are usually at least 20 minutes. In many cases, a protective atmosphere is not employed.
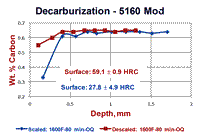
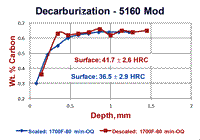
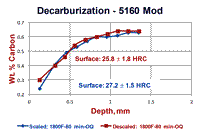
An experiment was conducted using round bars of 5160 Modified spring steel where specimens were austenitized either with the as-rolled mill scale present or with it removed by sand blasting. Specimens were austenitzied at 1600, 1700 and 1800°F (871, 927 and 982°C) for 80 minutes and then oil quenched. Part of each bar was incrementally machined (after scale removal by glass-bead blasting) and the carbon content was determined. Surface hardness readings, as shown in Fig. 2, were also made. The results are shown in Figure 3. Note that the specimen austenitized at 1600°F showed the largest difference between the surface carbon content and surface hardness comparing the bar that was covered with mill scale to the bar that was descaled. This difference was much smaller for the bars austenitized at 1700°F and almost non-existent for the two bars austenitized at 1800°F. Note that the surface hardness of the bars austenitized at 1800°F had approximately the same surface hardness as the mill scaled bar austenitized at 1600°F. However, as can be seen in Fig. 3, the core carbon content was reached at greater depths as the austenitizing temperature increased.
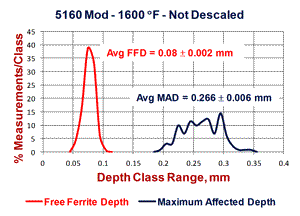
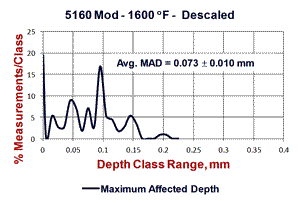
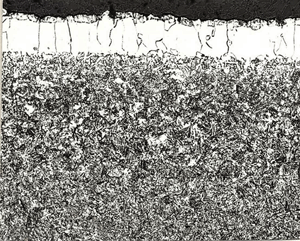
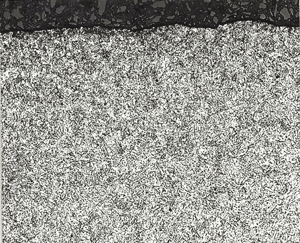
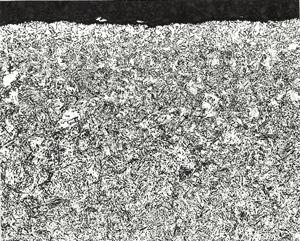
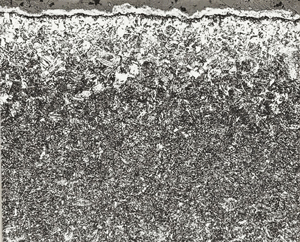
Figure 4 shows results of “quantitative” measurements of the FFD and MAD on the two specimens austenitized at 1600°F; 132 measurements for the scaled bar and 113 measurements for the descaled bar. The scaled bar austenitized at 1600°F exhibited a consistent free-ferrite layer around the periphery of the bar with an average depth of 0.08 ± 0.002 mm (95% confidence interval). Note that the distribution of FFD measurements is very narrow, or “peaked.” The MAD, however, had an average depth of 0.266 mm ± 0.006 mm and the distribution is quite broad (it may be Gaussian, but many more readings need to be taken to be sure). In contrast, for the descaled bar, no free ferrite was seen and 19.47% of the 113 measurements indicated no decarburization was present. The remaining measurements had an average depth of 0.073 ± 0.010 mm – slightly lower than the average FFD for the scaled bar. The MAD distribution curve is bi-modal. Figure 5 shows the typical microstructure observed at the surface of the six specimens.
The ability to obtain accurate, reproducible measurements of the depth of decarburization of steels depends on the quality of specimen preparation, the etching method, the nature of the microstructure in the affected surface layer, and the methods employed. Chemical analysis of incremental turnings or millings from the surface provides a complete description of the carbon content at the surface to the depth of the incremental analysis. However, this method is limited to certain simple shapes, such as round bars or plate, and it provides no information about the variability of decarburization around the surface. Its accuracy is somewhat influenced by the uniformity of the section shape as the first incremental machining step can be rather nonuniform.
Visual estimates of the maximum affected depth of decarburization generally produce more conservative estimates than the incremental carbon analysis procedure or the use of microindentation hardness traverses as it is very difficult to detect the final minor loss in carbon as the unaffected core is reached. Color etchants are probably much better for this purpose than black & white etchants like nital or picral, but comparative tests have not been performed. For annealed microstructures, the visual estimate of the average maximum affected depth is generally about 50-70% of the MAD determined by incremental carbon analysis or microindentation tests. This depth, however, can be considered to be an effective depth where the carbon content is usually within about 10-25% of the matrix carbon content and it will respond reasonably well to heat treatment. If the maximum observed MAD is used as a criteria for stock removal, the carbon content at the surface will be close to the matrix carbon content after machining.
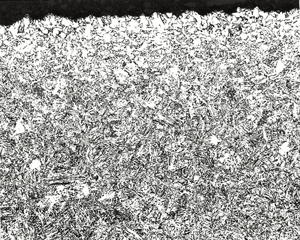
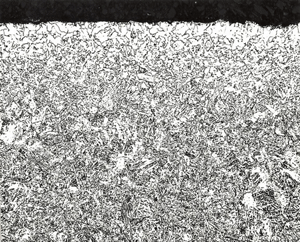
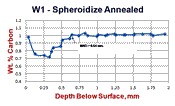
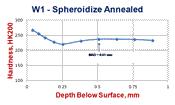
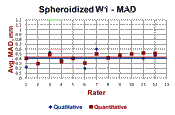
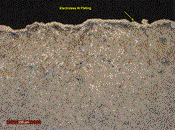
Examples of the variation in decarburization ratings by the three methods – carbon analysis of incremental turnings, microindentation hardness traverses and visual estimates by light microscopy (qualitative or quantitative) are shown in Figures 6 and 7. Figure 6 shows a spheroidize annealed microstructure of W1 carbon tool steel (~1% C), a typical specimen rated by mill metallurgists in plants that make tool steel. The microstructure is shown in Fig. 6d at 100X. The carbide in the decarburized surface zone is of a lower volume fraction than in the interior. Note the seemingly unusual carbon distribution at the surface, Fig. 6a. The lowest carbon content is only to about 0.7%, about a 30% loss. So, free ferrite is not present. Examination at 1000X would show that the cementite in the decarburized zone is not well spheroidized but is tending to be lamellar. This is because the annealing cycle cannot spheroidize the cementite in the lower carbon surface area compared to the bulk carbon content. Note that the hardness in the decarburized zone is actually greater than in the core! To most people, this would not be expected. But, this would not surprise a tool steel metallurgist as a coarse lamellar carbide structure, even with a lower volume fraction than the spheroidized core, would be harder (and less ductile). Measurement of the MAD in this sample after quenching and tempering (not shown) would be exceptionally difficult due to the minor change in appearance over the surface layer into the interior. The austenitizing temperature for W1 is chosen to dissolve only about 0.6% C in such a 1% C W1 tool steel to avoid grain growth and excessive retained austenite. Hence, the only difference would be in the amount of undisssolved cementite in the surface layer.
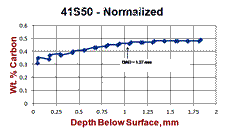
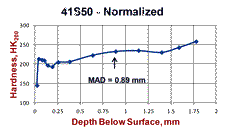
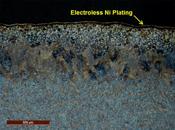
Figure 7 shows a normalized specimen of 41S50 ally steel where the surface carbon content was about 0.3% compared to a core carbon content of about 0.48% C. Note how the microstructure varies quite dramatically from the surface inward, despite the rather low loss of carbon (about a 37.5% loss). Again, no free ferrite is observed below the scaled surface. But, we note an initial zone of fine ferrite and pearlite. Beneath this zone we see a coarse lamellar pearlite zone and then the fine-grained, much finer lamellar spacing pearlite beneath in the unaffected interior. These variations in structure will also affect the microhardness traverse, Fig. 7b. Again, most people would expect the surface hardness to be quite low and then gradually increase going to the unaffected core. But, we can see that the microhardness traverse reveals much more variability related to the structural changes than one might expect.
 |
|
Table 1. Comparison of Decarburization Measurement Methods |
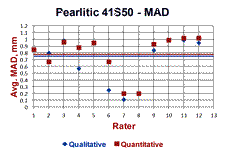
Table 1 summarizes the data presented in Figures 6 and 7. The carbon analysis of the incremental turnings was used as the best estimate of the maximum affected depth. Note that the estimate of the MAD was better using the Knoop traverses than the LOM measurements, but was still rather conservative with the MADs of 79.7 and 70% of the results from the carbon analysis. This is not really a problem as the hardness becomes essentially constant at a shallower depth than that shown by the incremental carbon analysis. The qualitative estimates, based upon a simple visual estimate going around the bar’s periphery, is slightly lower than the quantitative average which was based on 25 random measurements around the periphery (results are from an interlaboratory “round-robin” test program). One would probably have assumed that a visual estimate of the greatest MAD would be deeper than 25 randomly chosen measurements; this result was rather surprising.
Studies have shown that if the austenizing temperature is high enough, so that only austenite is present from surface to center, free-ferrite formation is suppressed. Austenitizing temperatures that produce ferrite and austenite in the surface layer promote free-ferrite formation. Diffusion of carbon to the surface occurs much faster in ferrite than in austenite which enhances growth of the existing ferrite. Scale from mill hot working that is present on the bar being heat treated, and even loose scale on the furnace hearth (5), will interact with carbon in the steel to promote decarburization (5-7) by the reduction of wustite, FeO, to Fe by carbon. Wieland and Rudzki (5) annealed 1095 carbon steel, and 5160 and 9260 spring steels in a nitrogen atmosphere at 1550°F for 7 hours using scale-free bars and bars with mill scale on the surface. The mill-scaled bars were decarburized to a greater depth than prior to annealing while the scale-free bars exhibited little decarburization – even less than was present before annealing.
Conclusions
Decarburization of steel parts is a serious problem as the weaker surface layer reduces wear resistance and makes fatigue failures easier to occur. A simple screening test was shown which can be utilized for certain shapes and high production runs. If the surface hardness is below some limit, which would vary with the grade, then a microstructural examination is required. Chemical analysis of carbon on incremental turnings (or millings) can be performed, but this is more of a research tool than a production tool. Metallographic rating of the depth of decarburization requires properly prepared specimens with good edge retention. This can easily be achieved with modern equipment and is reasonably fast. Qualitative measurements of the free-ferrite depth (when present) and the maximum affected depth of decarburization is usually adequate for most work. But such measurements are subject to bias and the reproducibility is not as good as when quantitative measurements are made using at least 25 randomly selected locations spread around the bar periphery. Image analysis techniques may be applicable depending upon the grade of steel. Microindentation hardness traverses are excellent for defining the MAD, but not for the FFD, as that depth may be quite shallow.
References
- A. Bramley and K. F. Allen, “The Loss of Carbon from Iron and Steel When Heated in Decarburizing Gases,” Engineering (London), Vol. 133, January 22, 1932, pp. 92-94; January 29, 1932, pp. 123-126; February 19, 1932, pp. 229-231; and, March 11, 1932, pp. 305-306.
- J. K. Stanley, “Steel Carburization and Decarburization – A Theoretical Analysis,” Iron Age, Vol. 151, January 21, 1943, pp. 31-35; January 28, 1943, pp. 36-39; and, February 4, 1943, pp. 49-55.
- F. E. Purkert, “Prevention of Decarburization in Annealing of High Carbon Steel,” J. Heat Treating, Vol. 2, No. 3, June 1982, pp. 225-231.
- H. W. Grasshoff et al., “Effect of Different Dew Points of the Heat Treating Atmosphere on the Skin Decarburization of Heat-Treatable Steels,” Stahl ünd Eisen, Vol. 89, No. 3, February 6, 1969, pp. 119-128.
- G. E. Wieland and E. M. Rudzki, “Effects of Furnace Design and Operating Parameters on the Decarburization of Steel,” Metal Progress, February 1979, pp. 40-46.
- R. Rolls, “Heating in the Drop Forge. Formation and Properties of Scales on Iron-Base Alloys,” Metal Forming, Vol. 34, March 1967, pp. 69-74.
- K. Sachs and C. W. Tuck, “Surface Oxidation of Steel in Industrial Furnaces,” ISI SR 111, London, 1968, pp. 1-17.
- E. Schuermann et al., “Decarburization and Scale Formation,” Wire Journal, Vol. 7, September 1974, pp. 155-164.
George Vander Voort has a background in physical, process and mechanical metallurgy and has been performing metallographic studies for 45 years. He is a long-time member of ASTM Committee E-4 on metallography and has published extensively in metallography and failure analysis. He regularly teaches MEI courses for ASM International and is now doing webinars. He is a consultant for Struers Inc. and will be teaching courses soon for them. He can be reached at 1-847-623-7648, EMAIL: georgevandervoort@yahoo.com and through his web site: www.georgevandervoort.com
To View a listing of all George’s articles please click here
Read George Vander Voort’s Biography

