Abstract
ASTM Committee E-4 on Metallography began a program to develop a test method for rating the nodularity of graphite in ductile iron in 1986. The initial effort centered upon using the sphericity equation to assess the shape. However, an interlaboratory study showed that the perimeter measurement varied with the magnification used. A perimeter-free shape factor based on the maximum Feret’s diameter was determined to be magnification independent and reliable. Additionally, two types of “convex perimeters” were proposed over the ensuing years, but they were demonstrated to be highly biased towards yielding high nodularity ratings regardless of the irregularity of the particle’s shape. The study reported here compared the use of the maximum Feret’s diameter in the shape equation to the mean Feret’s diameter, 100X vs. 200X, a minimum shape factor limit for a particle to be a nodule of 0.5 vs. 0.6, and calculation of an area-based vs. a number-based % nodularity.
Experimental Program
Measurements were made on a large number of graphite particles in eight specimens with a wide range of apparent nodularity and covering an average particle area from ~125 to 2400 μm2. Only particles with a maximum Feret’s diameter ≥ 10 μm were measured. Two screen magnifications were used, 100 and 200X. 100X was chosen as the AFS and ASTM charts depict graphite in cast iron at 100X, so metallographers are used to this magnification. For each particle above the required minimum Feret’s diameter, the area, minimum, mean and maximum Feret’s diameters were measured for all 8 specimens. The shape factor was calculated based on the actual area of the particle divided by the area calculated assuming its diameter was either the mean Feret’s diameter (mean FD) or the maximum Feret’s diameter (max FD); a perfectly circular particle has a shape factor of 1 (all others are <1). Then, the area % nodularity and the number % nodularity were calculated for data from both 100X and 200X images and for the shape factors calculated from the mean FD and the max FD, using both 0.5 and 0.6 as the minimum shape factor limit.
Results
The data from all of these conditions were tabulated by specimen, magnification, shape factor and minimum shape factor limit. It was immediately obvious that the mean FD shape factor yielded many shape factors above 1, which is theoretically impossible and nullifies the use of the mean Feret’s diameter. Table 1 lists the results for the eight specimens (ordered left to right according to increasing average particle area).
Table 1. Percentage of particles with shape factors >1.0 using the mean Feret’s diameter.

For the maximum Feret’s diameter, there were only a few particles with shape factors >1 and these were in the specimens with the smallest graphite particles and only for 100X measurements.
Conclusions
Particle area measurements were 3.6% greater using 100X compared to 200X. The max FD was 0.3% greater at 100X than at 200X. The mean FD was 0.8% greater at 100X than at 200X. For 15 of 16 cases, the average shape factors were 7.1% greater for 100X images than for 200X images. For all 16 cases, the average shape factor based on the mean FD was 25% greater than the average shape factor based on the max FD. The % nodularity (area % and number %) based on the mean FD was 19.4% greater than for the max FD using the ≥0.6 limit and 11.3% greater using the ≥0.5 shape factor limit. Overall, for the 100X and 200X images and using the mean FD and the max FD for the shape factor, the % nodularity (for both the area % and number %) averaged 85.22% for the ≥0.6 limit and 91.4% for the ≥0.5 limit. For the shape factors based on the max FD, the overall % nodularity was 86.6% and 77.7% for the ≥0.5 and ≥0.6 shape limits; and for the shape factors based on the mean FD, the overall % nodularity was 96.33% and 92.8% for the ≥0.5 and ≥0.6 shape limits, respectively.
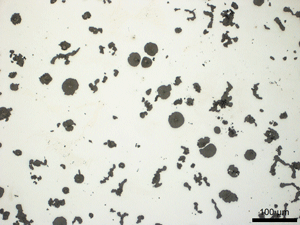
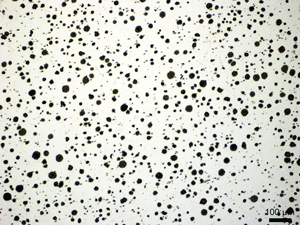
Above are examples of ductile iron specimens, the one on the left has well-formed spheroidal nodules and the one on the right graphite particles that exhibit a lower percentage of well-formed spheroidal nodules. Both specimens as-polished and both at 200X.
The mean Feret’s diameter produced a very high number of particles with shape factors >1.0, which is theoretically impossible. The percentage was greater for 100X images than for 200X images but 6 of the 8 specimens analyzed using 200X images had shape factors >1.0. The mean Feret’s diameter cannot be used to calculate the shape factor. For specimens with an average particle area <500 μm2, 200X is preferred over 100X using the maximum Feret’s diameter. The ≥0.5 shape factor limit is too liberal for calculating the % nodularity; the ≥0.6 shape limit gives more realistic ratings. There was no systematic trend between the area % nodularity ratings vs. the number % nodularity ratings. But, the standard should chose only one and AFS documents indicate that the area % nodularity relates better to structure-property data.
George Vander Voort has a background in physical, process and mechanical metallurgy and has been performing metallographic studies for 47 years. He is a long-time member of ASTM Committee E-4 on metallography and has published extensively in metallography and failure analysis. He regularly teaches MEI courses for ASM International and is now doing webinars. He is a consultant for Struers Inc. and will be teaching courses soon for them. He can be reached at 1-847-623-7648, EMAIL: georgevandervoort@yahoo.com and through his web site: www.georgevandervoort.com
To View a listing of all George’s articles please click here
Read George Vander Voort’s Biography


