Abstract
The accident at Unit No. 2 of the Three Mile Island nuclear reactor (TMI-2) on March 28, 1979 was the worst nuclear accident in US history and crippled the nuclear industry. It was not possible to remove specimens from the lower head until January – March 1990. Fourteen of the fifteen specimens removed by electrical discharge machining were from under the debris pile that accumulated on the lower head due to melting of ~19,000 kg (~45%) of the core. Specimens were previously cut from the lower head of a cancelled reactor of very similar size and design destined for Midland, Michigan. These specimens were subjected to controlled heating cycles with peak temperatures from 800 to 1100°C for periods of 1 to 100 minutes. The writer examined both sets of specimens and employed selective etching followed by quantitative metallography (by image analysis) to obtain a far more detailed description of the thermal exposure experienced than had been obtained previously.
Introduction
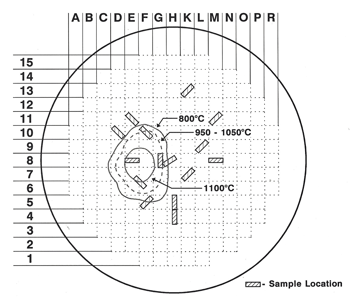
The accident at Unit 2 of the Three Mile Island nuclear power station began at about 4 am on 28 March 1979 – it was the worst nuclear accident in the US. In 1987, the Nuclear Regulatory Commission proposed formation of a joint international program, the Vessel Investigation Project (VIP), to study the incident. Members included representatives from Belgium, Finland, France, Germany, Italy, Japan, Spain, Sweden, Switzerland, the United Kingdom and the USA. Of course, actual examination of specimens from the reactor could not start until the vessel was defueled and the debris on the lower head was mapped, sampled and removed. In 1988, MPR Associates Inc. of Alexandria, Virginia, was hired to remove metallurgical test specimens from the lower head using a remote controlled electrical-discharge machining device designed for the purpose and to work under water (39 feet of radioactive water was in the vessel after the vessel was defueled and the debris was removed). Fifteen “boat-shaped” specimens were removed from the lower head; four of these were located at in-core penetrations. The boat-shaped specimens contained the ER308L stainless steel cladding and the ASTM A533 Grade B plate materials to a depth close to mid-thickness (the head could not be breached as the radioactive water would escape). The boat specimens measured about 70 x 165 x 65 mm deep and their location and coding is shown in Figure 1.
 |
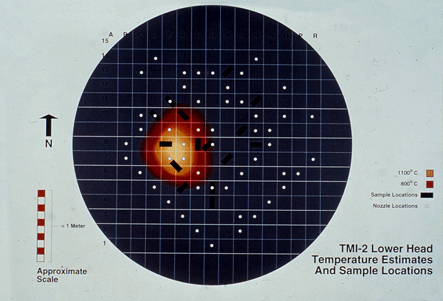 |
| Figure 1. Schematic showing the boat-shaped specimen locations relative to the debris pile and temperatures obtained during the incident. | Hot Spot Map |
Experimental Procedure
To help determine how hot each boat specimen sample got during the accident, the lower head of a very similar reactor built by Babcock & Wilcox for Midland, Michigan, but cancelled after the accident, was obtained. The lower head steel for both TMI-2 and Midland was made by Lukens Steel and both were 5 inch thick and weld clad on the inside with a 3/16-inch (4.8 mm) thick layer of ER308L stainless steel. The main difference was in the stress relief time at 607°C: 50 h for TMI-2 and 23.8 h for the Midland head. Specimens from the Midland reactor were heated to 800, 900, 950, 1000, 1050 and 1100°C and held for 1, 10, 30 and 100 min.
Two of the TMI-2 boat specimens, G-8 and E-6, had to be ground through the cladding to an unknown depth below the interface during decontamination; hence, measurements could not be made on two of the four specimens that saw the highest temperatures. When the microstructures were examined, a “dark feathery band” was observed at the weld metal-base metal interface, on the base-metal side. This band was also present at the interface on specimens removed from the Midland reactor head. It was observed on some of the TMI-2 boat specimens, but not on F-10 and E-8. A study of the control specimens revealed that this band began to dissolve upon reaching 900°C for 10 minutes. Carbides at the interface of the delta ferrite-austenite phases in the cladding went into solution after 100 min at 1000°C or after 10 minutes at 1100°C. In this temperature range the morphology of the delta ferrite changes.
Two features can be seen to change with temperature and time that can be quantified using standard quantitative metallographic procedures: the amount, spacing and morphology of the delta ferrite in the cladding and the carbides associated with the delta ferrite. Consequently, specimens were etched with modified Murakami’s reagent (90-100°C for up to 4 minutes) to darken the delta ferrite selectively and the standard Murakami’s reagent was used to darken the carbide (60-90 s at room temperature). The weld metal did contain a substantial inclusion content, which would be detected along with the darkened delta ferrite or carbides. Therefore, measurements were made of the volume fraction of the inclusions to subtract this value from the volume fraction of carbides and delta ferrite. With increasing temperature, the initial lacy, interconnected delta ferrite structure starts to break up into discrete particles that start to go into solution and spheroidize with time and temperature. So, for certain specimens, the mean shape (sphericity = 4πA/P2) factor was determined. The mean free path (mean edge-to-edge spacing in 360°) was also measured, as this distance changed with temperature and time.
Results
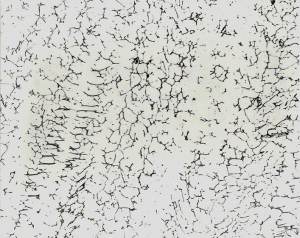
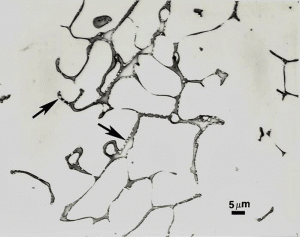
As a base point, measurements began with the lower head of the Midland reactor in the as-fabricated condition. Figure 2 shows the effect of temperature and time on the control specimens from the lower head of the Midland reactor.
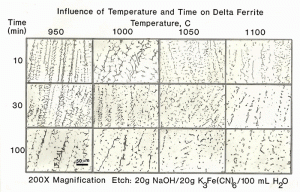 |
| Figure 2. Typical appearance of the delta ferrite in the weld cladding after thermal exposure. |
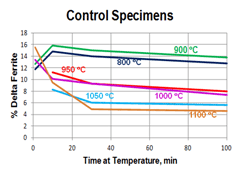
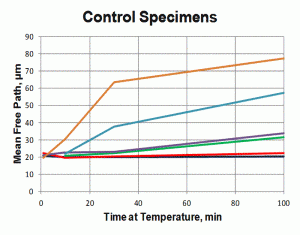
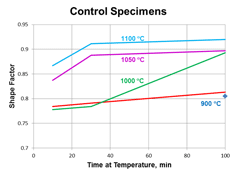
Quantitative measurements were made of the volume fraction of delta ferrite in the cladding after etching with modified Murakami’s etch at room temperature for about 2 minutes. For specimens heated high enough, and held long enough to break up the lacy, interconnected morphology of the as-fabricated delta ferrite, the mean free path was measured as well as the sphericity shape factor (4πA/P2). Figure 3 shows how the volume fraction of delta ferrite decreased with time at temperature. Note that heating at 800 and 900°C increased the amount of delta ferrite but with heating at 950°C and above, the delta ferrite content decreased. Figure 4 shows the effect of temperature and time on the mean free path, the mean edge-to-edge spacing between discrete particles, while Figure 5 illustrates the change in sphericity with time and temperature.
As for the control specimens, all of the reactor specimens were selectively etched using a variety of reagents to reveal the overall microstructure, to selectively darken either the delta ferrite or the residual carbides in the cladding. Quanititative measurements were made using an image analyzer. These measurements were compared to the trends in Figures 3 to 5 to gain an estimate of the maximum temperature experience by each specimen. Table I shows test results for the two Midland specimens as a comparison. The measurements were the volume fraction and mean free path of the delta ferrite in the cladding using modified Murakami’s reagent and the volume fraction of the carbides in the cladding using electrolytic ammonium hydroxide. These measurements were affected somewhat by detection of non-metallic inclusions in the cladding, mainly slag particles. Table II gives data for the TMI-2 boat specimens.
 |
| Table I. Variability of Measurements in the Two Midland Specimens |
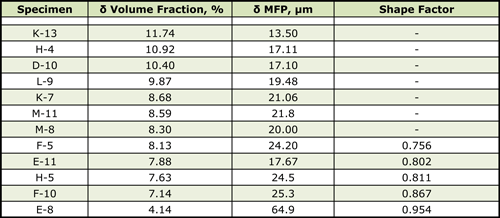 |
| Table II. Measurements of the TMI-2 Boat Specimens |
As can be seen comparing Tables I and II, only TMI-2 specimen K-13, which was the only TMI-2 specimen not under the debris pile, is similar in all respects to the Midland specimens.
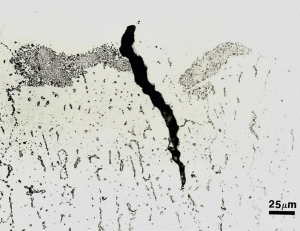
Figure 6 shows the microstructure of the delta ferrite in the as-fabricated Midland specimen. The 308L weld metal composition is balanced to yield about 12.5% delta ferrite which eliminates hot cracking during solidification. It has a fine interconnected, “lacey” morphology. Figure 7 shows an example of the complex carbide clusters, quite common in F-10, in the cladding at the interface. Note also the crack that has formed. Figure 8 shows an example of delta ferrite heated high enough to dissolve the M23C6 carbide that was in the delta ferrite at its interface with the austenitic matrix.
Discussion
The order given in Table II for the shape factor ranks these 5 specimens as having experienced the highest temperatures in that order, F-5 to E-8. F-5, with the lowest rated shape factor of the specimens with discrete globular particles of delta ferrite, had to have experienced at least 950°C for 60 – 100 minutes, or 1000°C for >40 minutes. E-11, H-5, F-10 and E-8 all experienced higher temperatures. Based upon the delta ferrite content, specimen K-13 experienced temperatures below 800°C, certainly less than the AC1. Specimens H-4, D-10 and L-9 all experienced temperatures of ~900°C for 100 minutes, or 950°C for 10-30 minutes. Specimens K-7, M-11, M8 and F-5 experienced temperatures of 950°C for 100 minutes, 1000°C for 30 minutes or 1050°C for 10 minutes. Specimens E-11 and H-5 experienced temperatures from 1000 – 1050°C. Specimen F-10 experienced about 1050°C for 30 minutes while E-8 experienced the highest temperatures, 1100°C for 30 minutes, or possibly 1125°C for about 10 minutes. Ratings based on the mean free path in the delta ferrite yielded somewhat similar estimates with only minor differences.
Conclusions
This study agreed with the VIP team’s overall conclusion that the TMI-2 lower head experienced a maximum temperature of about 1100°C for 30 minutes, which differed from the much higher exposure temperature estimate made by those who modeled the event. Carbides in the cladding, located at the interface between delta ferrite and austenite, went into solution at 1000°C for 30 minutes or 1100°C in 10 minutes. This study agreed that specimen M-11, which the UK VIP members thought experienced temperatures from 950°C for 100 minutes up to 1050°C for 10 minutes, did experience such temperatures. Eutectic carbide clusters were observed at the 308L cladding/A533 Grade B interface in F-10 and E-8 (more in F-10). These appeared to be M7C3 carbides. F-10 appeared to have cooled more slowly than E-8 after the incident, causing carbide to re-precipitate in the cladding.
George Vander Voort has a background in physical, process and mechanical metallurgy and has been performing metallographic studies for 47 years. He is a long-time member of ASTM Committee E-4 on metallography and has published extensively in metallography and failure analysis. He regularly teaches MEI courses for ASM International and is now doing webinars. He is a consultant for Struers Inc. and will be teaching courses soon for them. He can be reached at 1-847-623-7648, EMAIL: georgevandervoort@yahoo.com and through his web site: www.georgevandervoort.com
To View a listing of all George’s articles please click here
Read George Vander Voort’s Biography

