Abstract
The interlamellar spacing of pearlite is a very important microstructural parameter for steels containing pearlite, and becomes more important as the pearlite content increases towards a fully pearlitic microstructure. As the amount of pearlite in ferrite-pearlite microstructures increase, so does the strength, but toughness and ductility decrease. For a fully pearlitic steel, as the interlamellar spacing becomes finer, strength, toughness and ductility all increase. Consequently, in structure-property correlations it is important to measure the interlamellar spacing. This paper reviews procedures for performing such measurements. Due to the fineness of the spacing, either SEM images or TEM images of replicas or thin foils can be utilized. The range of spacings in a given specimen will be much narrower if the pearlite in the steel was formed isothermally rather than transformed over a range of temperatures, as in as-rolled or normalized steels.
Introduction
Interlamellar spacing data can be correlated to the heat treatment variables and to mechanical properties, such as strength, hardness and toughness. For wire drawing, near eutectoid grades exhibit better drawability, strength and ductility when isothermally transformed to produce the finest interlamellar spacing. Such measurements cannot be performed by light microscopy, except when the interlamellar spacing is very coarse. TEM or SEM examination is required. The sectioning plane effect is another factor that complicates analysis. Even when the pearlite is formed isothermally, yielding a minimal spacing range, the sectioning plane can cut through the pearlite colonies at all possible orientations relative to the lamellae thus giving the appearance of a greater diversity of spacing measurements than are actually present. As the sectioning plane deviates more and more from being perpendicular to the lamellae in a colony, the apparent spacing and the apparent thickness of the cementite lamellae increase.
Belaiew [1, 2] was one of the first people to study the problems associated with making interlamellar spacing measurements. He assumed, incorrectly, that the interlamellar spacing was constant and the observed spacing variations were only due to the sectioning plane effect. Green [3] measured the interlamellar spacing of pearlite in rail steel optically at magnifications between 2500 and 5000X. He assumed that the finest observed spacing in a colony was the true spacing based on his assumption that the actual spacing was constant and the observed variations were only due to the sectioning plane effect.
Pellissier et al. [4] were the first to show that the interlamellar spacing of pearlite, even when formed isothermally, was not constant but exhibited a range of spacings around a mean value, (mean) σ0. Their analysis indicated that the mean spacing was 1.65 times the minimum observed spacing. Other researchers found different values for the multiplier between 1.1 and 1.8 [5] and between 2 and 2.5 [6] times the minimum spacing. Brown and Ridley [7] utilized TEM replicas to measure the minimum spacing. They scanned the replica searching for the finest colony. Then, they adjusted the magnification, M, to fully resolve the lamellae. They used a circle inscribed on the viewing screen and counted the number of lamellae, n, crossed at right angles to the circle diameter, dc, and then calculated a minimum interlamellar spacing, σmin, by:
σmin = (1/n)(dc/M) (1)
This measurement was repeated on a number of colonies that appeared to exhibit the finest spacing to compute an average minimum spacing, (mean) σmin.
One basic problem with searching for the finest is that the finest spacing found is a function of the effort expended in the search, that is, the finest observed spacing varies with the effort extended in the search. Despite this problem, some studies [8] have claimed that searching for the minimum spacing produces the most reliable and consistent estimates of the interlamellar spacing. Perhaps the most common approach to measuring interlamellar spacing is to draw lines perpendicular to the cementite lamellae in each colony and then determine the apparent spacing based upon the number of lamellae intercepted divided by the true line length to give a directed spacing, σd. But, the mean value of a directed spacing is influenced by the sectioning plane effect and there is no direct way to calculate the mean true spacing, (mean) σt, from the mean directed spacing, (mean) σd.
Underwood [9] recommended determining the mean random spacing, σr, to estimate the mean true spacing, (mean) σt. Test lines can either be randomly drawn over the structure or a circular test grid of diameter, dc, can be utilized and is the easiest way to assure that a random spacing is measured. The number of intersections of the cementite lamellae, N. with the random test lines or the circumference of the circle is counted and the number of intersections per unit length, NL, is calculated by dividing N by the true line lengths or the true circle circumference per field measurement. The mean random spacing, (mean) σr, is determined as the reciprocal of NL:
(mean) σr = 1/NL (2)
The circular grid is ideal as it insures that a random spacing is measured. If the amount of pearlite is <50% of the field area the magnification must be raised to ensure that the circle covers only pearlite. But, to obtain the best statistics, the magnification used should be as low as possible so that the count of the intersecting cementite lamellae per test circle per field is as high as possible. The magnification should be high enough to resolve the lamellae and keep the test circle over the pearlite colonies without covering ferrite grains. Field selection should be unbiased using random field selection and a systematic selection of fields (ideally without watching the screen). A reasonably high number of fields should be assessed.
Saltykov [10] hypothesized that for pearlite with a constant interlamellar spacing, within each colony, the mean true spacing, (mean) σr, should be double the mean true spacing, (mean) σt . Gensamer et al. [11] found that this ratio varied between 1.9 and 2.0.
Experimental Procedure
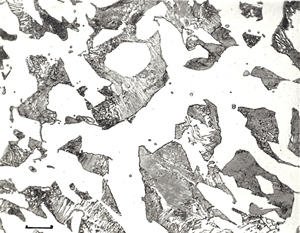
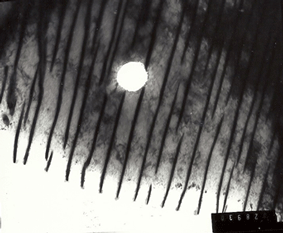
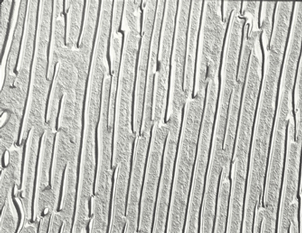
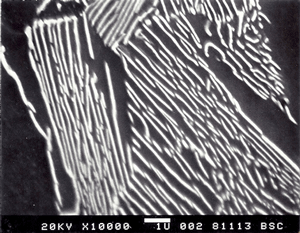
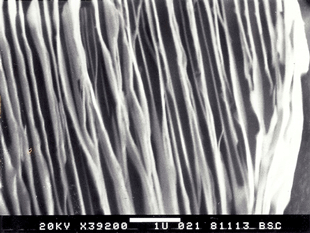
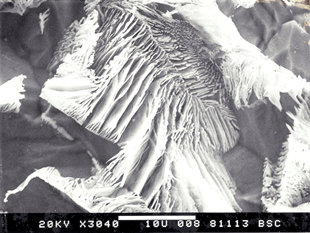
An as-rolled specimen of 1040 carbon steel was first utilized to assess the various methods used to measure the interlamellar spacing of pearlite. Figure 1 shows the microstructure after etching with 4% picral (picral is preferred to nital as it uniformly dissolves ferrite while nital etches at different rates according to the crystal orientation of ferrite). Figure 2 shows an example of a TEM thin foil where the foil has been tilted under the beam to make the cementite parallel to the beam showing the true spacing. Figure 3 shows a TEM replica where the specimen was lightly etched with 4% picral for best image contrast. Figure 4 shows a secondary electron image made with the SEM of a lightly etched specimen that was not tilted; the specimen surface is perpendicular to the beam so that the magnification does not vary across the field of view. Figure 5 shows a more deeply etched specimen where the lamellae are reasonably parallel to the electron beam and the observed spacings shown are true spacings. This is a good image for measuring the true interlamellar spacing. Figure 6 shows a very deeply etch image of the cementite in the pearlite; again, the specimen is tilted under the beam. This is a graphic image but not one conducive to obtaining accurate spacing measurements.
 |
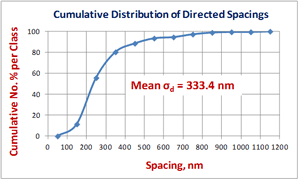 |
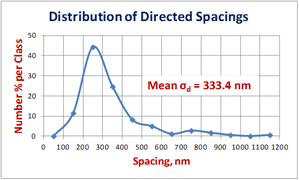
| Figure 7: Distribution of the 183 directed spacing measurements of the interlamellar spacing for randomly chosen pearlite colonies using TEM replicas. |
|
Two different people tried using the TEM replicas to find what they believed was the finest interlamellar spacing and obtained estimates of 168 and 175 nm, reasonably similar. According to Pellissier et al., the mean true spacing is 1.65 times the minimum spacing, that is, 277 and 289 nm for these two determinations of the minimum spacing. The next experiment using the replicas consisted of making a large number of measurements, 183, on randomly chosen pearlite colonies chosen without any bias, using test lines drawn perpendicular to the cementite lamellae, that is directed measurements, σd. Three measurements were made for the interlamellar spacing in each colony. The mean of the 183 measurements was 333.4 nm. The finest measured spacing was 123.7 nm, substantially finer than any colonies measured by the two people who searched for the finest. The coarsest spacing measured was 1130.2 nm. The randomly chosen colonies yielded a substantially finer spacing, 26.2% finer, than the finest found in the deliberate search for the finest spacing by the 2 operators. Figure 7 shows the distribution of the 183 directed TEM replica spacing measurements by spacing class and cumulatively.
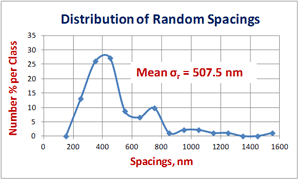
The same colonies measured with the directed test lines were also measured using circular test grids to estimate the mean random spacing, (mean) σr. The mean random spacing of 92 measurements using the test circle grids was 507.5 nm. Based on Saltykov’s determination that the mean random spacing is twice the mean true spacing, the mean true spacing, (mean) σt, is 253.8 nm. Figure 8 shows the distribution of the 92 random spacing measurements on the TEM replicas by spacing class and cumulatively. The smallest spacing measured was 201.4 nm and the largest was 1566.6 nm
 |
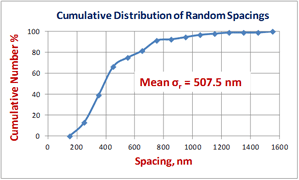 |
| Figure 8: Distribution of the 92 random spacing measurements of the interlamellar spacing for randomly chosen pearlite colonies using TEM replicas. |
|
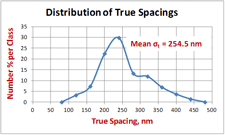
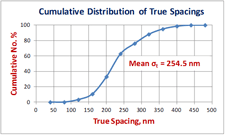
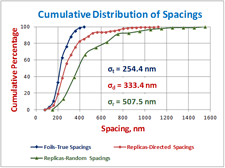
The next experiment utilized TEM thin foils where the foil was tilted while viewing randomly chosen pearlite colonies to align the cementite lamellae parallel to the beam thus revealing the true spacing. Three spacing measurements were made on photographs of the colonies for a total of 218 measurements. The smallest measured spacing was 100 nm while the largest spacing was 449.9 nm. The mean true spacing, (mean) σt, was 254.5 ± 9.0 nm (95% confidence limit) which agrees very well with the estimate based on random test lines (test circles) on TEM replicas. The finest spacing of 100 nm is substantially finer than detected by the other previously mentioned experiments. Figure 9 shows the distribution of the 218 true spacing measurements made on the tilted TEM foils by spacing class and cumulatively. Figure 10 plots the three cumulative data distribution plots for the directed and random TEM replica measurements and the true spacings using the tilted TEM foils.
The last experiment utilized SEM images of colonies etched deeply with 4% picral as shown in Figure 5. Fifteen micrographs were made of colonies that appeared to be oriented approximately perpendicular to the surface, as shown. The specimen was perpendicular to the electron beam. The average of the directed spacings, three per image, was 250 nm which agrees well with the true spacing using TEM foils tilted under the beam to reveal the true spacing. Then, the circular test grid was applied to the fifteen randomly selected images to determine the mean random spacing, 510 nm. One half of this mean random spacing is 255 nm, in reasonable agreement with the 250 nm value obtained on the 15 SEM images with cementite appearing to be perpendicular to the specimen surface, and in close agreement with the true spacing measurement using the foils and with the results using the random test circle spacing measurements using the TEM replicas. Directed spacing measurements were made on the fifteen randomly selected SEM images yielding a mean directed spacing of 320 nm, reasonably similar to the 333.4 nm mean directed spacing made on the TEM replicas.
The ratio of the mean value of the 92 random spacing measurements to the mean value of the 183 directed spacing measurements made on the TEM replicas was 507.5/333.4 = 1.52. The ratio of the mean of the random spacing measurements made on the SEM images to the mean of the directed images made on the SEM images (randomly selected images where the colonies had a wide range of orientations to the surface) was 510/320 = 1.59. These values are close to π/2 = 1.57, which is the approximate correlation between random spacing measurements and directed spacing measurements according to the model in [12].
Conclusions
Measurement of the interlamellar spacing of pearlite is simplest to determine with precision using properly prepared and etched metallographic specimens using circular test grids to determine the mean random spacing using either SEM replicas or SEM images (do not tilt the specimen; keep the surface perpendicular to the beam). A number of randomly chosen fields should be measured to obtain adequate statistical precision which can be assessed based upon the 95 % confidence limit divided by the mean value expressed as a percentage. If this is <10%, the precision is adequate. The mean true spacing is half the mean random spacing. The exhaustive TEM foil work demonstrated the validity of this calculation of Saltykov as well as by Underwood. Directed spacing measurements take more time and the correlation between the directed spacing measurement and the true interlamellar spacing is empirical in nature.
References
1. N. T. Belaiew, “The Inner Structure of the Pearlite Grain,” J. Iron and Steel Institute (London), Vol. 1105, 1922, pp. 201-239.
2. N. T. Belaiew, “On the Structure of Nodular Troostite,” J. Iron and Steel Institute (London), Vol. 124, 1931, pp. 195-214.
3. O. V. Greene, “Some Characteristics of Pearlite in Eutectoid Rail Steel,” Trans. ASST, Vol. 16, 1929, pp. 57-76.
4. G. E. Pellissier et al., “The Interlamellar Spacing of Pearlite,” Trans. ASM, Vol. 30, 1942, pp. 1049-1086.
5. G. Birkbeck and T. C. Wells, “Pearlite Morphology in Three Low-Carbon Steels,” Trans. AIME, Vol. 242, 1968, pp. 2217-2220.
6. M. K. Asundi and R. F. West, “The Kinetics of Pearlite Growth in Binary Aluminum Bronzes,” J. Institute of Metals, Vol. 94, 1966, pp. 19-23.
7. D. Brown and N. Ridley, “Rates of Nucleation and Growth and Interlamellar Spacings of Pearlite in a Low-Alloy Eutectoid Steel,” J. Iron and Steel Institute (London), Vol. 204, 1966, pp. 811-816.
8. M. P. Puls and J. S. Kirkaldy, “The Pearlite Reaction,” Met. Trans., Vol. 3, 1972, pp. 2777-2796.
9. E. E. Underwood, Quantitative Stereology, Addison-Wesley, Reading, MA, 1970.
10. S. A. Saltykov, Stereometric Metallography, 2nd ed., Metallurgizdat, Moscow, 1958.
11. M. Gensamer et al., “The Tensile Properties of Pearlite, Bainite and Spherodite,” Trans. ASM, Vol. 30, 1942, pp. 983-1020.
12. G. F. Vander Voort and A. Roósz, “Measurement of the Interlamellar Spacing of Pearlite,” Metallography, Vol. 17, 1984, pp. 1-17.
George Vander Voort has a background in physical, process and mechanical metallurgy and has been performing metallographic studies for 47 years. He is a long-time member of ASTM Committee E-4 on metallography and has published extensively in metallography and failure analysis. He regularly teaches MEI courses for ASM International and is now doing webinars. He is a consultant for Struers Inc. and will be teaching courses soon for them. He can be reached at 1-847-623-7648, EMAIL: georgevandervoort@yahoo.com and through his web site: www.georgevandervoort.com
To View a listing of all George’s articles please click here
Read George Vander Voort’s Biography

