Abstract
Measurement of the amount of phases or constituents in metals and alloys is probably the most commonly performed quantitative microstructural test. The amount present is usually referred to as the volume fraction, although it is rarely expressed as a fraction but usually as a percentage. The volume fraction, or VV, in stereological terms, is the volume per unit volume of the phase or constituent. However, there is no simple direct way to measure the volume fraction. Instead we measure the area fraction, AA, a lineal fraction, LL, or a point fraction, PP, which can be measured and correlate with the volume fraction:
VV = AA = LL = PP (1)
Areal analysis was first described by Delesse, a French geologist, in 1848. As the minerals were rather coarse in size, he could measure the area fraction of the grains of interest compared to the total two-dimensional area. As microstructures are rather fine in size, this is not a simple method to perform manually. Delesse suggested that a linear ratio of dimensions could also be used, but he thought that the accuracy would not be as good and did not try to develop a lineal analysis method. Rosiwal, a German geologist, was the first to publish a lineal fraction method in 1898 to assess the volume fraction. The point counting method to assess the volume fraction came much later and was proposed by Thompson in 1933, by Glagolev in 1933 and by Chalkey in 1943 – each working in different countries and different fields of science.
 |
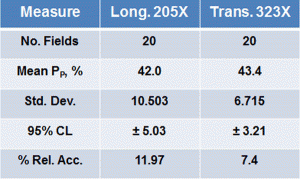 |
| Table 1. Manual Point Count, 25-Point Grid, Operator A. | Table 2. Manual Point Count, 25-Point Grid, Operator B. |
The point counting method was standardized in ASTM E562 in 1979. The test can be performed in a number of ways, such as with a graticule in the eyepiece or with two-dimensional plastic overlays placed on a projection screen or TV monitor. Generally, the latter are used as it is less tedious and a greater number of “points” can be used on a grid than on a graticule. Actual points are very difficult to see on a grid placed over a microstructure so small crosses are used where the point is the intersection of the horizontal and vertical lines in the cross. Some have used parallel lines oriented horizontally and vertically. The magnification must be great enough so that the location of the point relative to the microstructure can be determined easily. But, as the magnification is increased, the field-to-field variability of the point count also will increase. So, the lowest possible magnification should be used where the location of the point in the structure can be discerned reasonably easily. Fields should be selected at random. Always point count the phase of lowest amount in a two-phased microstructure as this is most efficient. If the volume fraction of the matrix phase is desired, point count the second phase (or constituent) and determine the amount of the matrix by difference, i.e., 100 – PP of the minor phase (in %). For point counting constituents with relatively low amounts, a 100-point grid is most commonly used. When the amount of the phase of interest exceeds ~25%, lower point density grids with be used, e.g., 64, 50 or 25 points (systematically placed on the grid to make finding them easier).
 |
 |
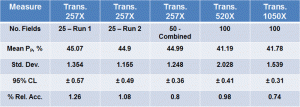
| Table 3. Image Analysis Measurement of β Phase – Transverse Plane. | Table 4. Image Analysis Measurement of β Phase – Longitudinal Plane. |
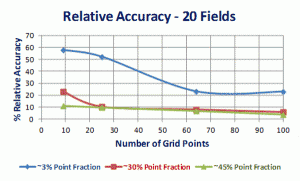
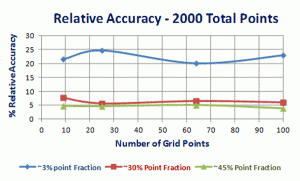
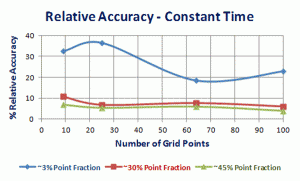
As an example of the selection of the point density of the test grid and test variables, such as the number of fields measured, counting with different point grid densities and counting with a constant time per point grid density, Figure 1 is presented [1]. In this experiment specimens with ferrite-pearlite microstructures containing ~3, ~30 and ~45% pearlite were point counted using 9, 25, 64 and 100-point grids using a constant number of fields, 20, per test, a constant total number of counts, 2000, and a constant time, 11 minutes. Figure 1 illustrates the % relative accuracy, % RA, for each of the four test grid densities under the three test condition (the 95% confidence limit divided by the mean point fraction for each grid placement, expressed as a percentage). In general, obtaining a % RA <10% is considered to be adequate for manual test measurements. The results demonstrate that measuring a low volume fraction requires the most effort to obtain a low % RA. The 9-point test grid gave the poorest results while the 100-point grid gave the best % RA for all three measurement variables, constant number of fields, constant total points counted and constant measurement time.
Volume fractions can also be determined using an automatic image analyzer (AIA). The phase or constituent of interest is detected based upon gray level differences and those pixels in the detected constituent are counted and divided by the total number in each field. This is an exceptionally dense point counting grid, but the systems can make the count in a small fraction of a second. The precision in estimating the point fraction in each phase by image analysis is much higher than when that field is assessed manually with a 25, 50, 64 or 100 point grid.
Results
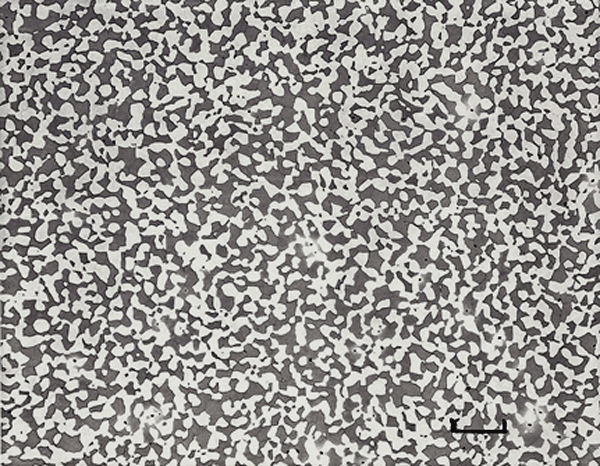
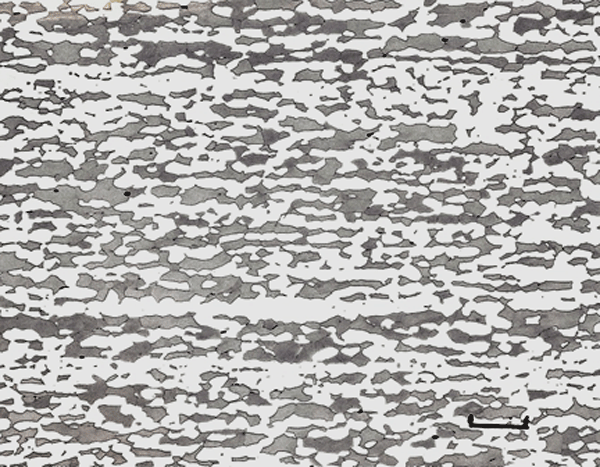
To further illustrate the measurement of a second phase using point counting and using image analysis, and determining the effect of magnification, measurements were made of beta phase in Naval Brass, CDA 464. The specimen was an annealed and cold drawn bar with a diameter of about 8.8 mm and a hardness of ~89 HRB. The composition was: 59.31% Cu – 39.89% Zn – 0.68% Sn plus minor amounts of impurity elements. Longitudinal and transverse specimens were prepared and etched with Klemm’s I tint etch to color the beta phase, but not the alpha-Cu matrix phase, Figure 2.
Manual point counting was first performed by two different people using a 25 point test grid according to ASTM E562. Each person was told to select the best magnification for the measurements on each test plane, that is, the lowest magnification where the grid points could be easily determined to be in the beta phase, or the alpha phase, or upon a phase boundary. Table 1 presents the results from the two operators. Operator A made 22 field measurements on the longitudinal and transverse specimens using two magnifications. The grid was placed on the projection screen of the Leitz MM6 metallograph and the screen magnifications were 323X and 805X. Table 1 shows that 323X gave essentially the same volume fraction using both magnifications on both specimen orientations. The volume fraction on the longitudinal specimen done at 806X agreed with these results, but the transverse specimen analyzed at 806X had a higher volume fraction (statistically significant difference). The relative accuracies were essentially the same for the longitudinal specimens and transverse specimens when comparing the same orientation at each magnification, but the 95% confidence limits and the % RA of the transverse specimens were better (lower) than for the longitudinal plane due to the more uniform beta phase distribution on the transverse plane, as shown in Figure 2.
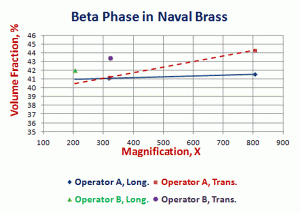
Results for operator B are given in Table 2. This operator choose a single screen magnification for each specimen orientation, 205X for the longitudinal plane and 323X for the transverse plane. He made 20 field measurements on each plane. His volume fraction measurements are slightly higher than obtained by operator A at 323X while his 95% confidence limits and % RA values are very similar. Figure 3 plots the volume fractions measured by operators A and B as a function of magnification.
 |
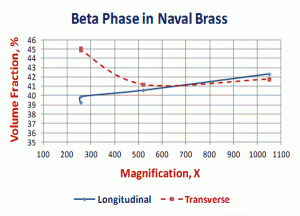 |
| Figure 3. Volume fraction of β phase in Naval Brass by point counting with a 25-point test grid per E562. | Figure 4. Volume fraction of β phase in Naval Brass measured by image analysis. |
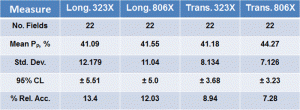
The specimens were next evaluated using an automatic image analyzer using three magnifications for each specimen orientation. Results are listed in Table 3 for the transverse plane and Table 4 for the longitudinal plane. Objective magnifications used were 8X, 16X and 32X giving screen magnifications of 257X, 520X and 1050X. At 257X, two runs, each with 25 fields were made. These results were also combined and analyzed, as shown in Tables 3 and 4. For the 520X and 1050X runs, 100 fields were analyzed. The total areas examined at each magnification were: for 257X – 18.22 mm2 and 36.44 mm2 for 25 and 50 fields, respectively; for 520X – 17.97 mm2; and, for 1050X – 4.46 mm2.
For the transverse specimen, Table 3, run at 257X, the volume fractions were high, about 45%. This was about 0.7% higher than the 806X manual point count data by operator A and about 1.6% higher than the 323X manual point count by operator B. The 520X and 1050X data agreed closely with the other manual point count data from operator A. The 95% CL data and the % relative accuracy data for the image analysis specimens in Table 3 are much better than the manual point count data in Table 1.
For the longitudinal specimen, Table 4, run at 257X, the volume fractions were lower than obtained by manual point counting, while the results using 520X and 1050X were in good agreement with the manual point count data. Again, the 95% confidence limits and % RA data for the image analysis data are substantially better than for the point count data.
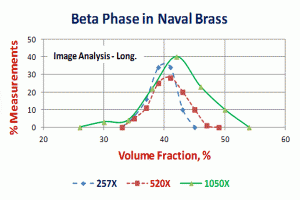
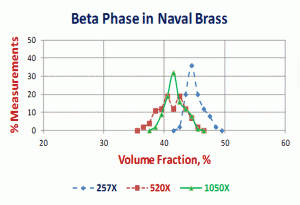
Figure 4 plots the volume fraction data for the image analysis runs at each magnification on the two planes. It is clear that the 257X data for the transverse specimen is too high. This indicates that the beta phase detection was incorrect and a higher magnification was needed. Ignoring this data, we see a trend of slightly increasing volume fraction with increasing magnification, although the differences are minor. Figure 5 shows the distribution of the field measurements of the volume fraction of beta phase measured on the longitudinal specimen for the three magnifications. Note that the peaks shift slightly to higher values with increasing magnification. Figure 6 shows distribution curves for each magnification, but for the transverse specimen field measurements of the volume fraction. Here we see that the distribution curve for the 257X data is shifted markedly to the right, that is, higher volume fractions, compared to the data at 520X and 1050X which were nearly identical (statistically, no difference).
Averaging the 520X and 1050X image analysis volume fractions for both planes gives a mean of 41.46% beta. The mean value for operator A’s point count measurements was 42.02%, in reasonably good agreement. The mean value for operator B’s two point count measurements was 42.7%, slightly higher.
Conclusions
Obtaining reproducible, precise volume fraction data requires close control of every step in the process. This starts with sampling, which was not an issue in this work, but generally is in most industrial and research studies. Specimen preparation must remove all damage associated with the sectioning, grinding and polishing process and the etchant chosen must be selective in nature (when etching is required to reveal the feature of interest) and clearly reveal phase/constituent boundaries. The magnification chosen must enable proper detection of the phase of interest. This is not a trivial issue as illustrated by the tests shown. Manual point counting is performed by some laboratories, although image analysis has a number of advantages in that for the same total measurement time, or less, better statistical precision can be obtained.
Reference
1. G. F. Vander Voort, Metallography: Principles and Practice, McGraw-Hill Book Co., NY, 1984; ASM International, Materials Park, OH, 1999, pp. 433-434..
George Vander Voort has a background in physical, process and mechanical metallurgy and has been performing metallographic studies for 47 years. He is a long-time member of ASTM Committee E-4 on metallography and has published extensively in metallography and failure analysis. He regularly teaches MEI courses for ASM International and is now doing webinars. He is a consultant for Struers Inc. and will be teaching courses soon for them. He can be reached at 1-847-623-7648, EMAIL: georgevandervoort@yahoo.com and through his web site: www.georgevandervoort.com
To View a listing of all George’s articles please click here
Read George Vander Voort’s Biography

