Abstract
The control chart data analysis approach is an ideal method to evaluate the quality of test data using a specific tester, such as a microindentation hardness tester, over a period of usage time. The method described in ASTM E2554 was used for this work. This analysis is done by plotting a means and a standard deviation control chart of the weekly/periodic verification data obtained with certified hardness test blocks at a specific test force and a specific hardness level. The method is illustrated using a Knoop hardness test block certified at a test force of 500 gf and with a long diagonal length of 116.18 μm (527.1 HK). From this data, one can easily calculate the uncertainty of the measurements.
Introduction
The Control Chart method described in ASTM E2554, and discussed by Neil Ullman, (1) is an ideal procedure for evaluating the performance of hardness testers as it will detect any abnormalities that may occur with usage time. The control chart concept was first developed by Walter Shewhart in 1931 to define the state of statistical control and to detect random or special problems. In 1933, ASTM Committee E1 produced STP 15, “ASTM Manual on Presentation of Data.” This was supplemented in 1935 with “Presentation ± Limits of Uncertainty of an Observed Average,” the first use of the term “uncertainty” in statistical analysis of test data. Today, additional information on control charts is provided by E2587. Either a range chart or a standard deviation chart can be prepared. If the variations observed appear to be random, an estimate of repeatability can be calculated. A means control chart can also be prepared to detect variations among time periods. If the control charts demonstrate that statistical control is present, the uncertainty can be assumed to be approximately equal to the repeatability standard deviation.
To prepare a standard deviation control chart, list the weekly (or periodic) verification indent length values sequentially with time and calculate the standard deviation for each set of 3 (or 5) indent measurements made on each test block for each weekly/periodic verification test. Then, plot the standard deviation of the weekly verification data according to the time sequence of the weekly verifications. The means control chart is prepared by plotting the mean value of each of the 3 (or 5) indent measurements made for each weekly verification test. The 3 or 5 verification indents are made within a short time period, generally <10 minutes, not over an extended time period. Plot the mean of each weekly verification test according to the time sequence of the weekly verifications.
It is recommended that when a new machine is installed, or a new indenter is utilized, or a new test block is obtained, that the weekly verification be performed each day for about 20-25 consecutive working days. This daily verification data will be used to establish the upper and lower control limits. After that period, a weekly/periodic verification procedure is adequate unless the indenter must be physically removed from the machine and replaced by another, or repaired and re-inserted.
The mean standard deviation is computed by dividing the sum of the 20 or 25 (or more) standard deviations of each weekly verification by the number of tests, p:
Mean s = ∑ s/p (1)
The upper control limit for the standard deviation values is determined as:
UCLs = B4 * Mean s (2)
where B4 for 3 measurements is 2.568 and B4 for 5 measurements is 2.089 (see Table 2 in E2554 for values of B4 for sample sizes from 2 to 6). The lower control limit for 2 to 5 tests is 0 (see Table 2 in E2554).
The means control chart is prepared by plotting the mean value of each weekly/periodic verification test as mentioned previously. The sample means are averaged for the first 20-25 (or more) means of each weekly (or daily, as preferred) verification test. The grand mean of the 20-25 initial weekly verification means is calculated. The control limits for the means control chart are calculated by:
UCL = Grand Mean + (A3 * Mean s) (3)
LCL = Grand Mean – (A3 * Mean s) (4)
Table 2 in E2554 lists A3 values for 2 to 6 tests; A3 for 3 tests is 1.954 and A3 for 5 tests is 1.427.
Example of the Method
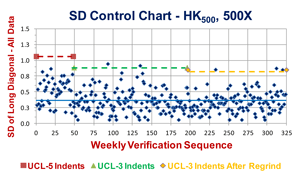
Weekly/periodic verification test data was obtained for a Knoop hardness test block where the certified long diagonal length at 500 gf was 116.18 μm (the mean of 5 means of 5 indents. Note: It would be better to calculate the mean of the 25 indents used to certify the test block, but this data was not supplied) with a standard deviation of 0.130384 (based on the 5 mean values of 5 sets of 5 indents). The mean HK 500gf was 527.1. Figure 1 shows the standard deviation control chart using 5 indents for each weekly verification test for the first 48 tests. After that, the test standard was changed recommending only 3 indents per verification. The first 48 weekly verification tests were used to calculate a mean s and the UCL (the LCL = 0). Then, the standard deviation for the next 148 sequential weekly verification tests (3 indents per test) before and 128 verification tests (also 3 indents per test) after the indenter was re-ground are shown.
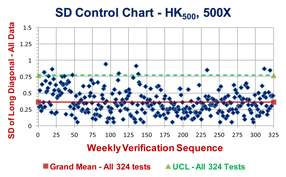
Figure 2 shows a similar plot, but for all of the 324 verification test results using a grand average for the standard deviation, 0.3638, which is less than for the first 48 verification test values but slightly greater than the remaining 276 verification tests using 3 indents per verification. At least 9 verification test results exceeded the upper control limit for all 324 tests. The value of plotting the standard deviations according to the variations in the machine operation and the number of indents per verification (Figure 1) is obvious.
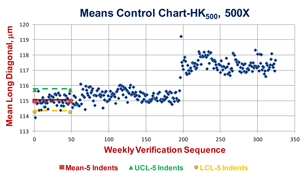
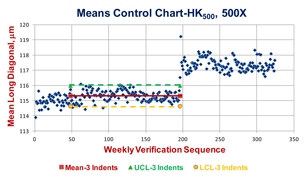
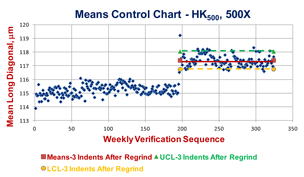
The means control chart was plotted and is shown in Figure 3a, b and c. The mean for the first 48 tests using 5 indents was 114.99 μm (538.05 HK); for the 148 tests before the re-grind, the mean was 115.32 μm (534.96 HK); and, for the 128 tests after the regrind, the grand mean was 117.41 μm (516.13 HK). The UCL for the first 48 weekly verifications was 115.72 μm and the LCL was 114.26 μm. The UCL for the 148 tests using 3 indents per verification was 116.0 μm and the LCL was 114.65 μm. After the regrind, the UCL for the next 128 verification tests was 118.05 μm and the LCL was 116.76 μm. This shows that the re-grind had a pronounced influence on the test block results. The standard deviation control chart shows no difference before and after the regrind, in comparison.
Note that the mean values using 5 indents per test, in the first 48 verification tests, yielded a slightly lower mean value and slightly lower UCL and LCL values compared to using only 3 indents per verification test. The data in this study shows that using 5 indents per verification is better from a statistical viewpoint than using 3 indents per verification test. The last test, no. 196, before the re-grind yielded a noticeably higher long diagonal measurement of 116.53 μm (523.9 HK), above the UCL for the first 48 (115.72 μm) and above the UCL value for the next 148 (116.0 μm) After the regrind, the very first verification test yielded a substantially higher value, 119.23 μm (500.5 HK) than before, or after. Hence, the means control chart was very effective in showing the need for a regrind and the subsequent influence of the regrind of the indenter upon its test data.
The plots in Figure 3 of the means control charts for the Knoop test block (500 gf certified diagonal of 116.18 μm) for the mean values of the first 48 weekly verification tests (5 indents per verification), and then 148 verification tests (3 indents per verification) before the indenter was re-ground; and, then 128 weekly verification tests (3 indents per verification) after it was re-ground vividly revealed the need for a regrind (test 196) and the effect of the re-grind upon the subsequent indenter test results. The grand mean of the first 48 weekly verification tests was 114.99 μm (538.05 HK); for the 148 weekly verification tests before the re-grind the grand mean was 115.32 (534.96 HK); and, for the 128 weekly verification tests after the re-grind, the grand mean was 117.41 μm (516.13 HK). For the first 48 weekly verification tests, the UCL was 115.72 μm while the LCL was 114.26 μm. For the next 148 verification tests the UCL was 116.0 μm and the LCL was 114.64 μm, not too different. But, after the regrind, the UCL was 118.05 μm and the LCL was 116.76 μm, a substantial increase. Note that the weekly verification means test data after the indenter was re-ground were all above the UCLs before the re-grind indicating a change in the indenter’s performance.
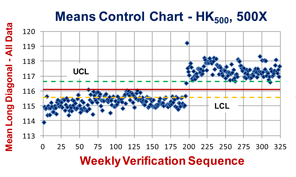
As a follow up, Figure 4 shows all of the mean diagonal values of the verification tests ignoring the different conditions of the verification test and the re-grinding of the indenter. The mean value of all the data and the UCL and LCL of all of the tests are almost meaningless, compared to the plots in Figure 3.
Conclusions
The control chart method defined in ASTM E2554 is a straightforward excellent method for examining the weekly/periodic verification data to determine if the microindentation hardness tester is performing properly. The data suggests that the use of 5 indents per verification is better statistically than using 3 indents per verification. These test results discovered that the 196th verification test produced a statistically longer diagonal measurement than previously encountered. Of course, when the user did this test, they immediately noticed that the mean diagonal of the 3 indents were greater than observed before, as the same person did all of these tests. But, if a variety of people were doing the verifications, this may not have been as obvious. But, using the control chart method, it was obvious that the 196th verification result was unusual and required examination of the indenter tip. Consequently, the indenter was sent out and re-ground. But, after the re-grind, the control chart method noted a distinct shift in the verification test results. From the control chart data one can easily calculate the uncertainty of the test data.
Reference
1. N. Ullman, “Easy Estimation of Measurement Uncertainty,” ASTM Standardization News, November-December 2014, pp. 20-22.
George Vander Voort has a background in physical, process and mechanical metallurgy and has been performing metallographic studies for 47 years. He is a long-time member of ASTM Committee E-4 on metallography and has published extensively in metallography and failure analysis. He regularly teaches MEI courses for ASM International and is now doing webinars. He is a consultant for Struers Inc. and will be teaching courses soon for them. He can be reached at 1-847-623-7648, EMAIL: georgevandervoort@yahoo.com and through his web site: www.georgevandervoort.com
To View a listing of all George’s articles please click here
Read George Vander Voort’s Biography

