 The control chart data analysis approach is an ideal method to evaluate the quality of test data using a specific tester, such as a microindentation hardness tester, over a period of usage time. The method described in ASTM E2554 was used for this work. This analysis is done by plotting a means and a standard deviation control chart of the weekly/periodic verification data obtained with certified hardness test blocks at a specific test force and a specific hardness level. The method is illustrated using a Knoop hardness test block certified at a test force of 500 gf and with a long diagonal length of 116.18 μm (527.1 HK). From this data, one can easily calculate the uncertainty of the measurements.
The Control Chart method described in ASTM E2554, and discussed by Neil Ullman, is an ideal procedure for evaluating the performance of hardness testers as it will detect any abnormalities that may occur with usage time. The control chart concept was first developed by Walter Shewhart in 1931 to define the state of statistical control and to detect random or special problems. In 1933, ASTM Committee E1 produced STP 15, “ASTM Manual on Presentation of Data.” This was supplemented in 1935 with “Presentation ± Limits of Uncertainty of an Observed Average,” the first use of the term “uncertainty” in statistical analysis of test data. Today, additional information on control charts is provided by E2587.
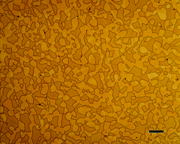
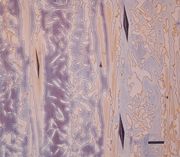
Image caption: Microstructure of wrought 7-Mo Plus duplex stainless steel (Fe – <0.03% C – 27.5% Cr – 4.2% Ni – 1.75% Mo – 0.25% N) electrolytically etched with aqueous 20% NaOH (3 V dc, 5 s) to color the ferrite blue. There is some light yellow-tan coloring of the austenite. The average Knoop hardness of the austenite was 361.8 HK and that of the ferrite was 263.5 HK. Magnification bar is 20 µm in length. 7-Mo Plus is a registered trademark of Carpenter Technology Corp., Reading, Pennsylvania.


